👀 Copy Legendary Investors' Portfolios in One ClickCopy For Free

US Oil Technical Analysis: Waiting For Break Above $46

Published 09/15/2015, 08:18 AM
Updated 07/09/2023, 06:31 AM
USD/ZAR
-
US500
-
CL
-

Talking Points:

  • USOil Technical Strategy: Waiting For Break Above $46
  • Oscillators like RSI have kicked higher similar to the prior 50% run-up in April.
  • Breakout of Corrective Triangle could define positioning for future positions.

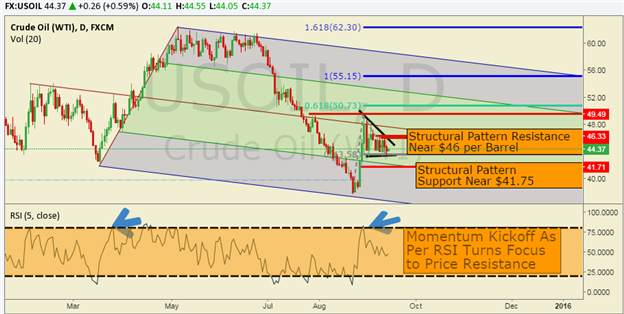
The technical outlook for crude oil comes into specific focus this week due to the turn higher in oscillators followed by a sideways congestion pattern. A break above $46 a barrel would allow a likely run into prior resistance of $49.49 per barrel before looking to the 100% Fib extension of the move up from the $37 low toward $55 a barrel followed by the 1.618% extension near the May high of $62 a barrel.

Given the strength of the trends in summer of 2014, focus will be on prior structural support around $41.75 per barrel. A break below there would favor move back near annual lows and a continuation of the overall trend. The technical picture for the US dollar index, which shows an inverse correlation to crude oil, lacks clarity though the market has moved away from the 12,100 zone multiple-times since March. Another breakdown from 12,100 would favor a potential break higher in Oil.

Currently, the sideways price action to open the month of September turns focus to the swift move higher move from $37 a barrel on August 24 to $49 a barrel on August 31before the consolidation. A correction implies the prior move will resume which was a 30% move higher over seven days. A break above near-term structure resistance at $46 a barrel could open up another multi-percentage move as those who have stayed with the downtrend may further unload their short positions after 21+ days could see another unwindhigher similar to the April move.

Correlated Markets: should a significant break out or breakdown happen in oil, it would be worth it to look tothe highly positive correlationof equity markets and emergence market currencies to confirm. You could look to a move higher in the S&P 500 to likely align with the move higher in oil. Additionally, a potential move higher in oil should also align with a move lower in USDEMFX like USDZAR, which is moved higher as oil traded lower.
Oil Chart

Original post

Latest comments

Loading next article…
Risk Disclosure: Trading in financial instruments and/or cryptocurrencies involves high risks including the risk of losing some, or all, of your investment amount, and may not be suitable for all investors. Prices of cryptocurrencies are extremely volatile and may be affected by external factors such as financial, regulatory or political events. Trading on margin increases the financial risks.
Before deciding to trade in financial instrument or cryptocurrencies you should be fully informed of the risks and costs associated with trading the financial markets, carefully consider your investment objectives, level of experience, and risk appetite, and seek professional advice where needed.
Fusion Media would like to remind you that the data contained in this website is not necessarily real-time nor accurate. The data and prices on the website are not necessarily provided by any market or exchange, but may be provided by market makers, and so prices may not be accurate and may differ from the actual price at any given market, meaning prices are indicative and not appropriate for trading purposes. Fusion Media and any provider of the data contained in this website will not accept liability for any loss or damage as a result of your trading, or your reliance on the information contained within this website.
It is prohibited to use, store, reproduce, display, modify, transmit or distribute the data contained in this website without the explicit prior written permission of Fusion Media and/or the data provider. All intellectual property rights are reserved by the providers and/or the exchange providing the data contained in this website.
Fusion Media may be compensated by the advertisers that appear on the website, based on your interaction with the advertisements or advertisers.
© 2007-2024 - Fusion Media Limited. All Rights Reserved.