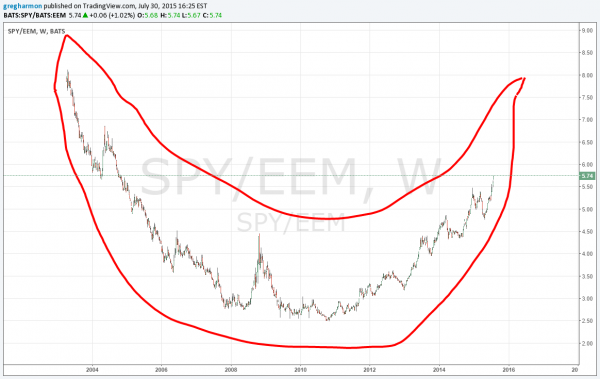
Above is the ratio of the S&P 500 SPDR ETF SPDR S&P 500 (ARCA:SPY) to the Emerging Market ETF iShares MSCI Emerging Markets (ARCA:EEM) on a weekly timeframe since the inception of the Emerging Market ETF. It looks like a smile right? Or maybe a mouth you might place on a Jack-o-lantern. But it is not Halloween for another 3 months. Maybe by then the right side of the mouth will be a bit higher, adding more symmetry.
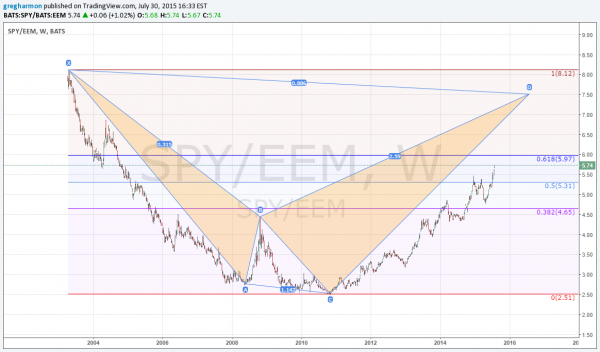
Seriously, this chart does tell a lot about the world economy and the speed of the recovery in the US compared to the lesser developed world. I have ‘professionalized’ the chart below for some quick analysis.

There are three important patterns on this chart and all suggest that smile will continue to grow. The first is that rounded bottom and reversal noted earlier. The second is the Fibonacci retracement ratios. The long leg down from 2003 to the base form 2009 to 2010 has now been retraced over 50%. Having moved far away from that 50% line expect the next potential area to find resistance at the 61.8% retracement up at 5.97.
Third is a Shark harmonic pattern that would target a move to 7.48 in the ratio or 8.85 if that does not stop it. Either way it is well above the current level. The 3 patterns together add some confidence to the continuation and a growing smile in the US at the expense of Emerging markets.
The information in this blog post represents my own opinions and does not contain a recommendation for any particular security or investment. I or my affiliates may hold positions or other interests in securities mentioned in the Blog, please see my Disclaimer page for my full disclaimer.
