Equities were a sea of red and the US dollar gained yesterday, with risk aversion rolling somewhat into the Asian session today. It seems that investors remained nervous ahead of today’s inflation data for April from the US. Expectations are for strong advances in both the headline and core rates, which may raise speculation that the Fed should start normalizing its policy earlier.
Risk Aversion Continues In Light Of US CPIs
The US dollar traded higher against all but one of the other G10 currencies on Tuesday and during the Asian session Wednesday. It advanced the most versus CHF, NZD, and AUD, while eked out the least gains against GBP and SEK. The greenback was found virtually unchanged against JPY.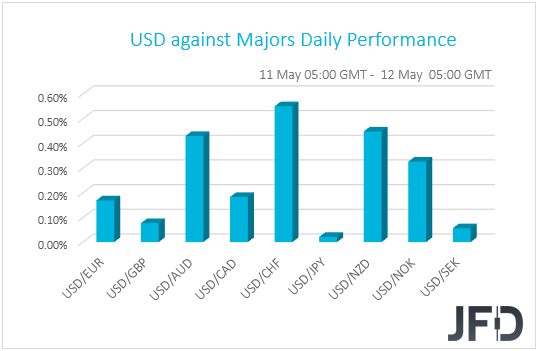
The strengthening of the US dollar and the Japanese yen, combined with the weakening of the risk-linked Aussie and Kiwi, suggests that market participants continued to reduce their risk exposure yesterday and today in Asia. Indeed, turning our gaze to the equity world, we see that major EU and US indices were a sea of red, with UK’s FTSE 100 losing the most, perhaps due to the relative strength in the British pound. Remember that many companies of the index generate profits in other currencies, so in a strengthening GBP environment, if those profits are converted to pounds, they worth less. The negative appetite, although somewhat improved, rolled over into the Asian session today as well.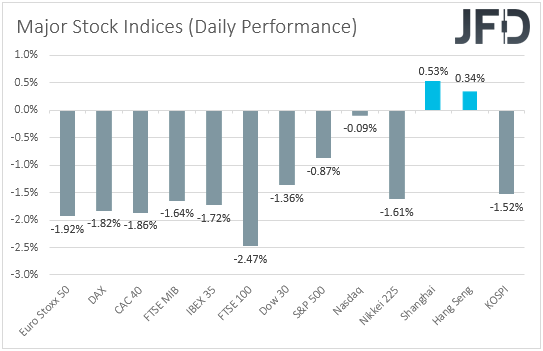
As we noted yesterday, investors may have been nervous ahead of today’s US CPIs for April. The headline rate is expected to have rallied to +3.6% yoy from +2.6%, further above the Fed’s inflation goal of 2.0%, while the core rate is anticipated to have increased to +2.3% yoy from +1.6%. The fact that the core rate is expected also to climb decently higher may raise questions as to whether the surge in headline inflation will prove to be temporary and thus, whether the Fed should start considering scaling back its monetary policy earlier.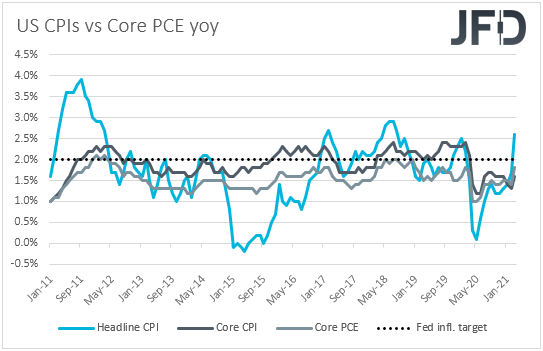
That said, with the US employment report disappointing on Friday, it seems that Fed officials may not be in a rush to alter their policy any time soon. Indeed, some of them spoke yesterday and their comments were among those lines. Cleveland President Loretta Mester said that she would like to see more strength in the labor market, while Board Governor Lael Brainard noted that they are far from their goals. Atlanta President Bostic and Philadelphia’s Harker were clearer in stating that there is no reason to withdraw monetary policy support yet.
With that in mind, we believe that even if equities keep sliding and the US dollar strengthens a bit more after the CPIs, this will just prove to be an extended correction. We stick to our guns that with the Fed willing to stay accommodative for long, US President Biden willing to add more fiscal support to the economy, and the covid vaccinations progressing at a decent pace around the globe, risk appetite is likely to improve again at some point soon. In other words, equites are likely to rebound, while the US dollar and other safe havens, like the Japanese yen, are likely to come under renewed selling interest.
S&P 500 Technical Outlook
The S&P 500 continues to slide, after hitting the all-time high on Monday, at 4244. Even if the decline continues, we might still consider this move lower as a temporary correction if the price remains above a medium-term tentative upside support line taken from the low of Oct. 30. For now, we will take a cautiously-bullish approach.
A further slide below the 4110 hurdle, marked by yesterday’s low, and below the 50-day EMA, might bring the price closer to the 4048 hurdle, or the aforementioned upside line. If that line provides good support, the S&P 500 may rebound and make its way higher again. If the index climbs back above the 4147 obstacle, it could end up traveling somewhere closer to the 4219 level, marked by the high of Apr. 29. Slightly above it sits the current all-time high, at 4244, which might get tested as well.
On the other hand, if the aforementioned upside line breaks and the price falls below the 3982 zone, marked near the highs of March 16, 26 and 2, that may signal a change in the current trend and open the door for further declines. The S&P 500 may drift to the 3939 obstacle, a break of which could set the stage for a push to the 3853 level, marked by the low of Mar. 25.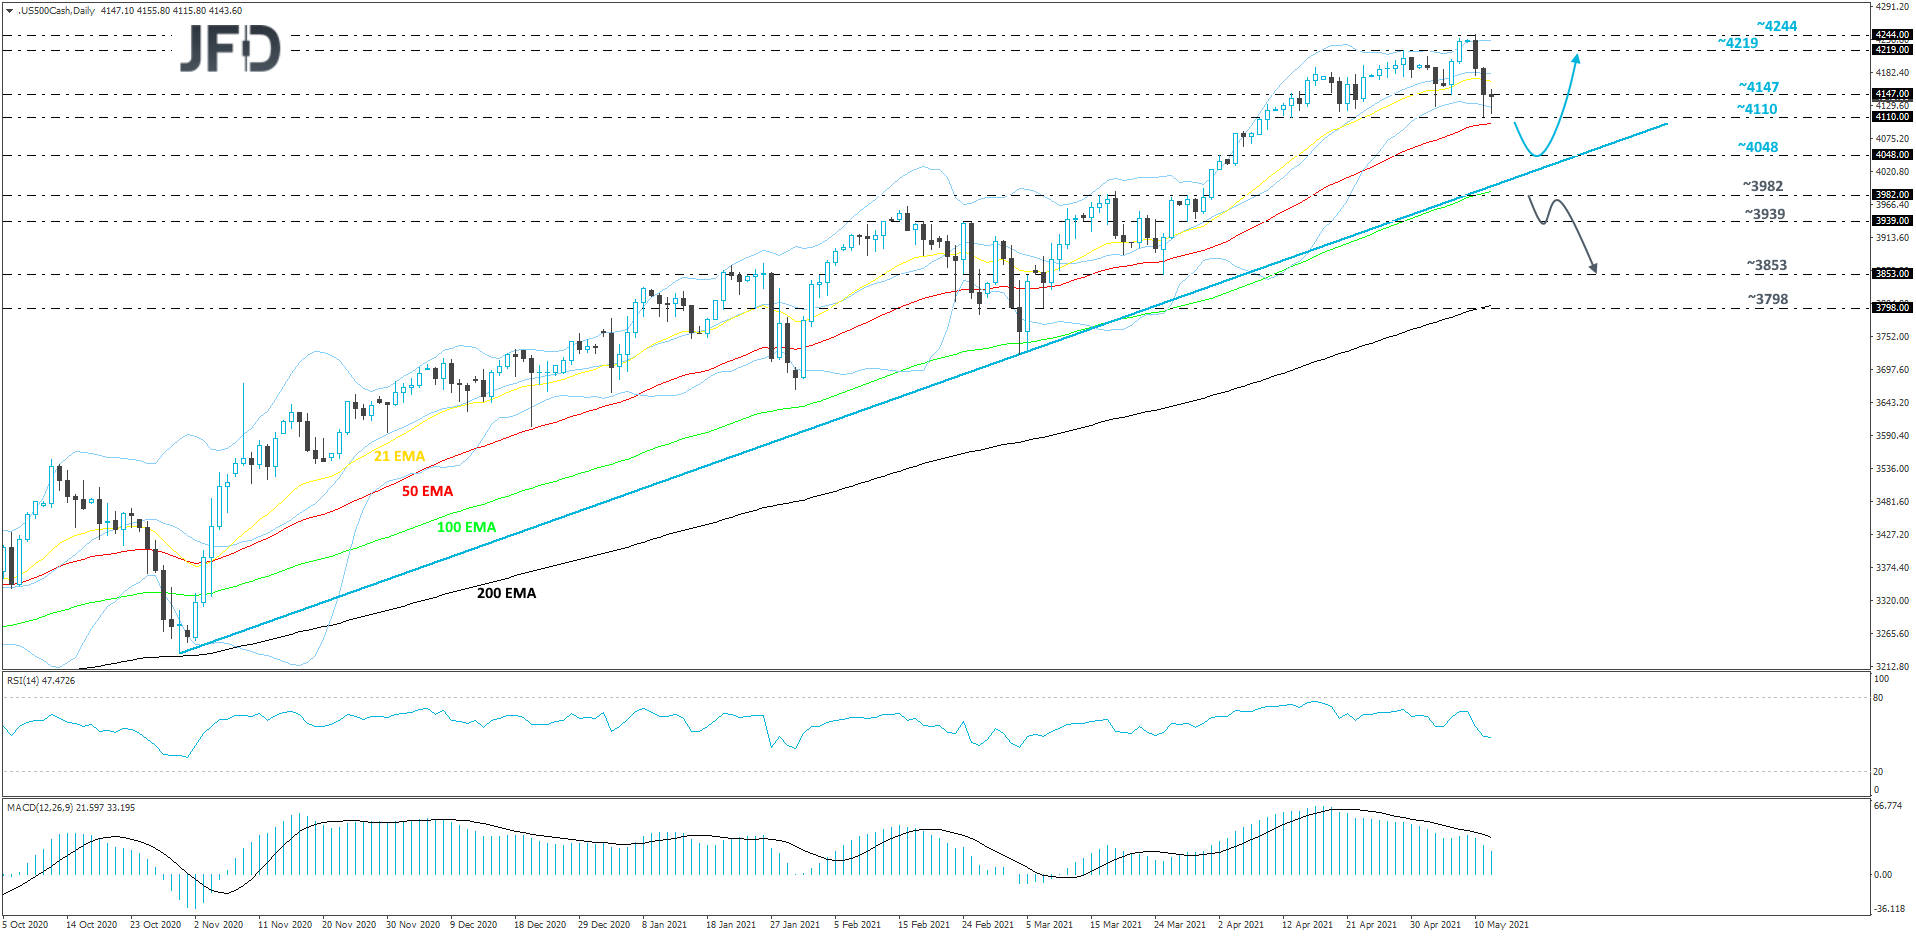
USD/JPY Technical Outlook
The 108.35 hurdle, which is marked near the lows of May 7 and 11, continues to hold the USD/JPY from moving lower. That said, the pair is still forming lower highs, while trading below a short-term downside resistance line taken from the high of May 3. There is a slight indication that we might see further declines, however, a break below the 108.35 zone would be needed first. Hence our cautiously-bearish approach for now.
If, eventually, USD/JPY falls below the previously-mentioned 108.35 hurdle, this will confirm a forthcoming lower low, possibly opening the door for further declines. The pair might fall to the 108.16 obstacle, or to the 108.05 zone, marked by an intraday swing low of Apr. 26. The rate could rebound back up from there, but if it struggles to climb back above the 108.35 area, another slide may be possible. If this time USD/JPY can overcome the 108.05 obstacle, the next potential target could be at 107.85, marked by an intraday swing high of Apr. 26.
Alternatively, if the pair breaks the aforementioned downside line and climbs above the 109.05 barrier, marked by the high of May 10, this may lead to a change in the short-term directional move, potentially clearing the path to some higher areas. USD/JPY might travel to the 109.05 obstacle, or to the 109.48 zone, marked near the highs of May 4 and 5. If the buying doesn’t stop there, the next possible aim might be the 109.70 level, marked by the current highest point of May.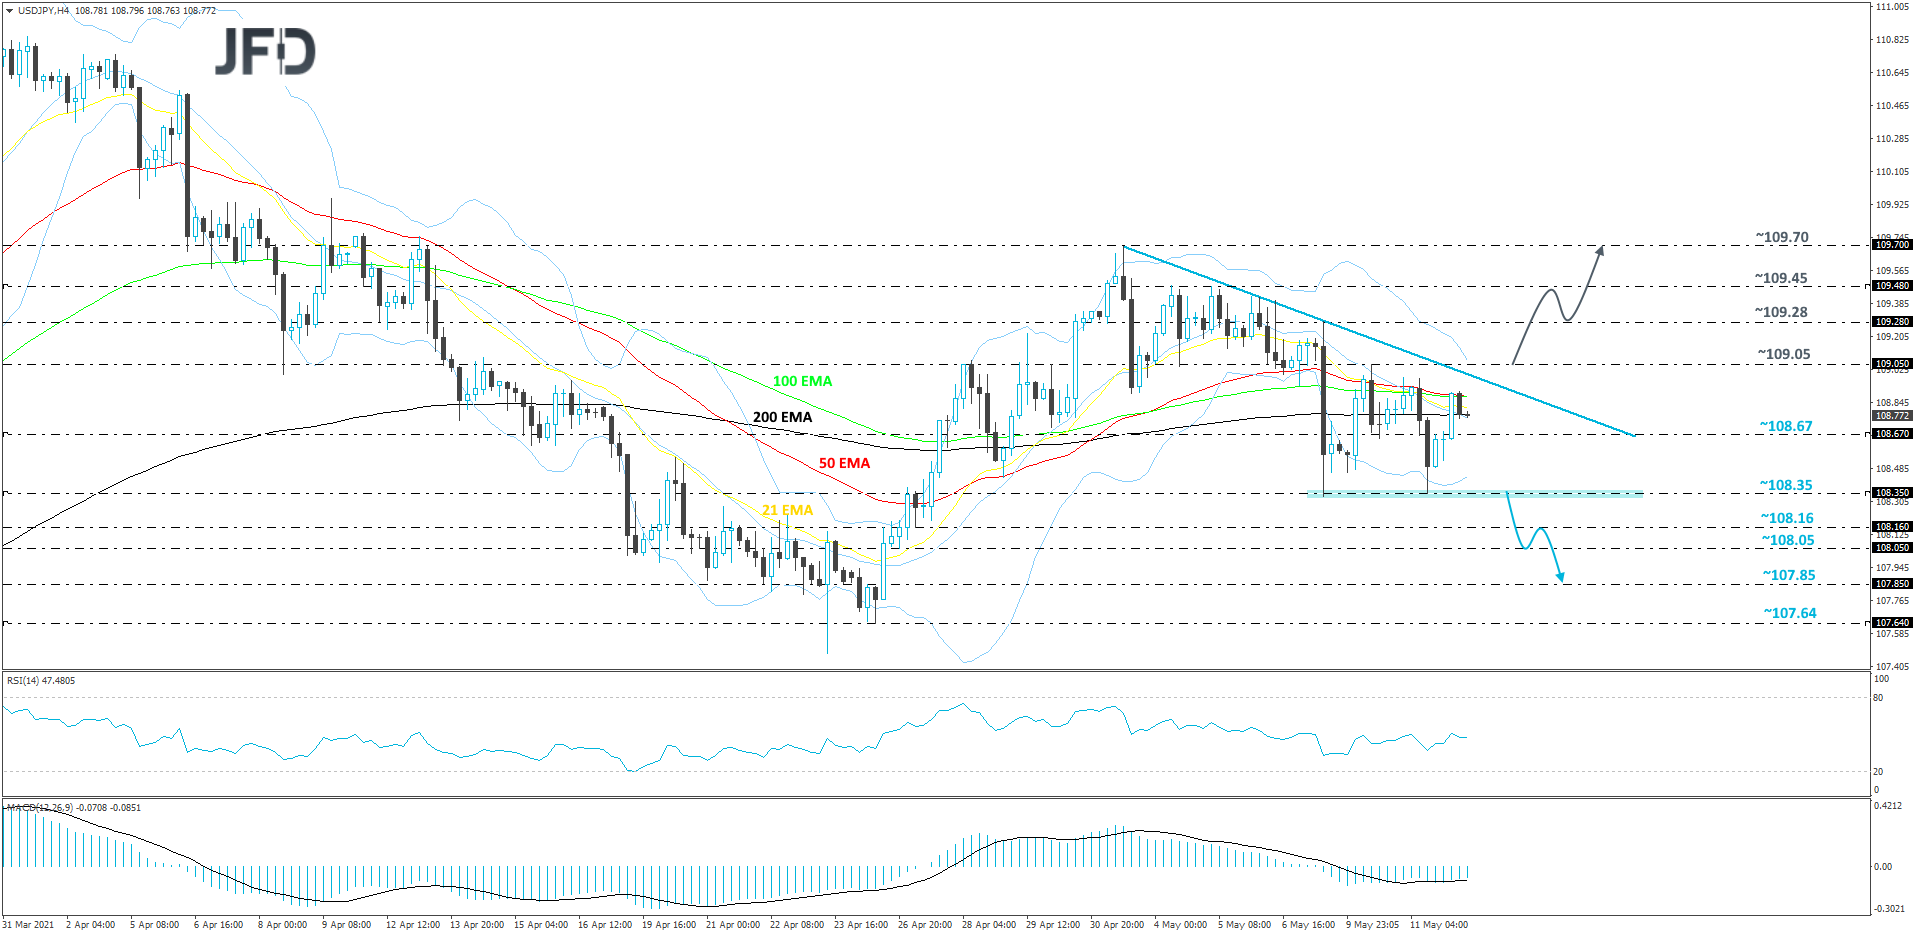
As For The Rest Of Today's Events
During the early European morning, we already got the UK GDP data for Q1. It was revealed that the UK economy contracted by less than anticipated during the first three months of 2021, but as we have been anticipating, the mom rate for March showed decent expansion. The industrial and manufacturing production rates for the month were also higher than expected.
This adds more credence to the BoE’s decision to scale back the pace of its bond purchases at its latest gathering and comes in line with the Bank’s view that the economy may return to its pre-pandemic size in the last quarter of this year, a quarter earlier than previously thought. With that in mind, GBP-traders may get encouraged to add to their long positions, especially against the US dollar and the Japanese yen, which, as we already noted, we expect to come under renewed selling interest at some point in the not-too-distant future.
With regards to the energy market, we get the EIA (Energy Information Administration) report on crude oil inventories for last week, with expectations pointing to a 2.817mn barrels slide following a fall of 7.990mn barrels the week before.
Tonight, during the Asian session Thursday, we have Australia’s wage price index for April, which is expected to slow to +1.1% yoy from +1.4%. At last week’s gathering, the RBA said that despite the strong economic recovery in Australia, inflation pressures remain subdued in most parts of the economy and that at the July meeting, they will consider further bond purchases following the completion of the second AUD 100bn purchases in September. Thus, with wages slowing even further, the chances for more QE by the RBA may increase.
As for the speakers, we will get to hear again from New York Fed President John Willaims, San Francisco Fed President Mary Daly, Atlanta Fed President Raphael Bostic, and Philadelphia Fed President Patrick Harker. BoE Governor Andrew Bailey will also step up to the rostrum.
