The US stock market (S&P 500) continues to trade below its record high, which was set in January, but the bull market is arguably still running. Any number of threats could derail the trend, including a trade war that may be escalating between the US and China. But for the moment, there’s still room to argue that the upward bias in stocks, although battered of late, is intact.
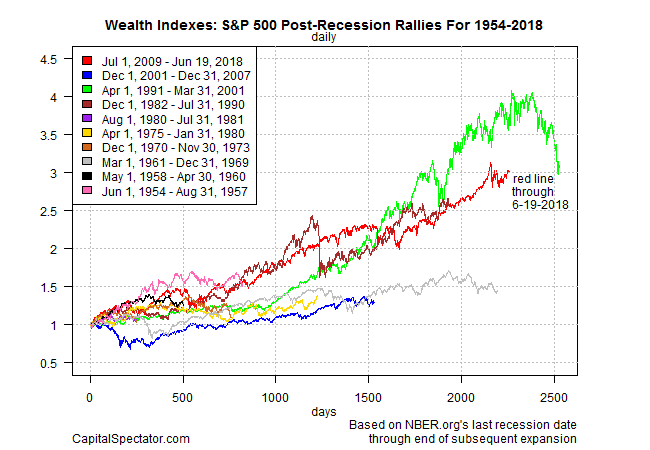
If we date bull markets from the end of recessions, the current rally in the S&P is now the second-longest on record since the mid-1950s. At yesterday’s close (June 19), the S&P 500’s bull regime has been bubbling for 2,258 trading days (red line in chart below). That’s second only to the 10-year run (2,528 days) through March 31, 2001 (green line).

In terms of performance, the current rally (+201%) ranks second only to the 1991-2001 gain (+209%).
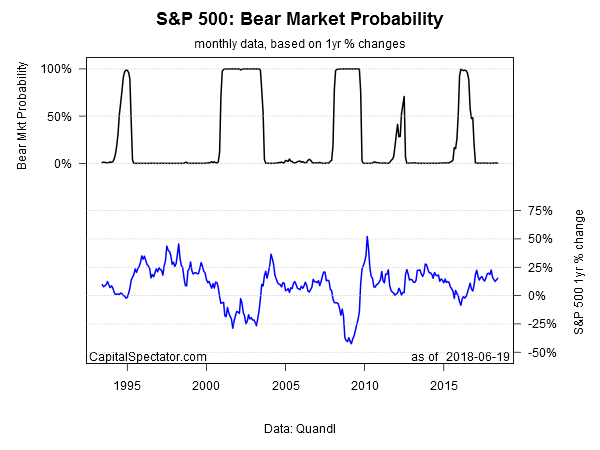
It’s debatable if the market at the mid-point in 2018 will reach new highs anytime soon, or even if the bull-market label still applies. But using an econometric technique (Hidden Markov model, as detailed here) suggests that the crowd has yet to cry uncle.

One reason for thinking that the US stock market can hold its ground and perhaps even reach new highs in the not-so-distant future: US recession risk remains low. The future is as uncertain as ever, but the numbers published to date suggest that growth train is still running. That calculus may be due for a revision, depending on how the current trade spat between the US and China plays out. But as discussed yesterday, there’s a good case for expecting that the US GDP growth for the second quarter will post a hefty acceleration over the sluggish Q1 gain.
Even if a trade war worthy of the name breaks out, the Q2 data looks destined to deliver solid results. Q3 and beyond, on the other hand, is subject to all the usual caveats. On that note, some analysts are already saying that the bubbly Q2 GDP numbers could be the peak for growth. Bloomberg today reports:
US growth “is close to a peak” and momentum will be “cooling from here,” said Gregory Daco, head of U.S. macroeconomics at Oxford Economics in New York. The trade risks “come at a point when the economy itself is in the late stage of the business cycle, it’s already close to capacity, where you can’t easily substitute for imports, and businesses are worried about trade tensions.”
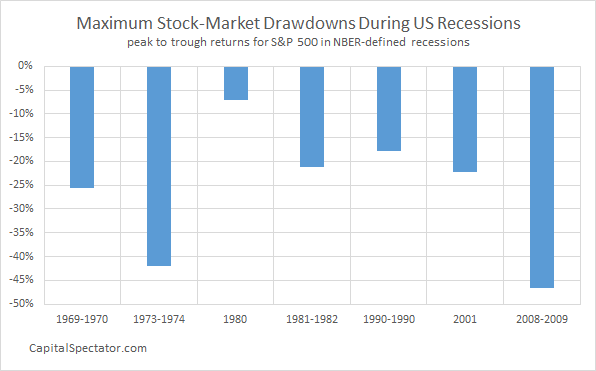
On that note, the business cycle is an obvious place to start when it comes to looking for a catalyst that could derail a bull market in stocks. Equities can crumble for any number of reasons, but an economic contraction is arguably at the top of the list for known risk factors. S&P 500 drawdowns in each of the past seven recessions ranged from roughly 7% to nearly 50%.

The good news is that there’s no sign of a US recession at the moment, although a new round of macro risk emanating from rising trade tensions could alter this rosy analysis. Meantime, the bull regime for stocks that began nine summers ago is still bubbling, or so one can argue. A critical variable for deciding if that diagnosis is due for an attitude adjustment: upcoming announcements from the White House on trade policy.
