The U.S.’ immunity to international economic weakness continues. In their latest policy statement, the Fed once again described U.S. growth as “moderate.” With the exception of industrial production, this week’s economic releases confirm that assessment. Retail sales rose, building permits were up and the leading indicators increased. Largely due to the negative impact of the strong dollar and oil sector weakness, industrial production provided the only negative news. Technically, the markets continue consolidating in upward sloping channels. But third quarter earnings projections continue to move lower, meaning there will be a dearth of support for a sustained upward move.
The Economic Environment
On Wednesday, the Federal Reserve issued its latest policy statement where they maintained their current interest rate and asset purchase policy. The statement contained the following assessment of the US economy:
Information received since the Federal Open Market Committee met in July suggests that economic activity is expanding at a moderate pace. Household spending and business fixed investment have been increasing moderately, and the housing sector has improved further; however, net exports have been soft. The labor market continued to improve, with solid job gains and declining unemployment. On balance, labor market indicators show that underutilization of labor resources has diminished since early this year. Inflation has continued to run below the Committee's longer-run objective, partly reflecting declines in energy prices and in prices of non-energy imports. Market-based measures of inflation compensation moved lower; survey-based measures of longer-term inflation expectations have remained stable.
Thanks to the strong dollar and weaker overseas economies, exports were the only area of weakness. And like other central banks, the Fed believes inflation’s weakness results from low commodity prices.
U.S. retail sales, an important coincident indicator of consumer activity, rose .2% M/M and 2.2% Y/Y. Car sales increased .7% M/M and 5.7% Y/Y. As the following graph (which is calibrated to an index of 100) shows, both statistics remain in a solid, long-term uptrends:
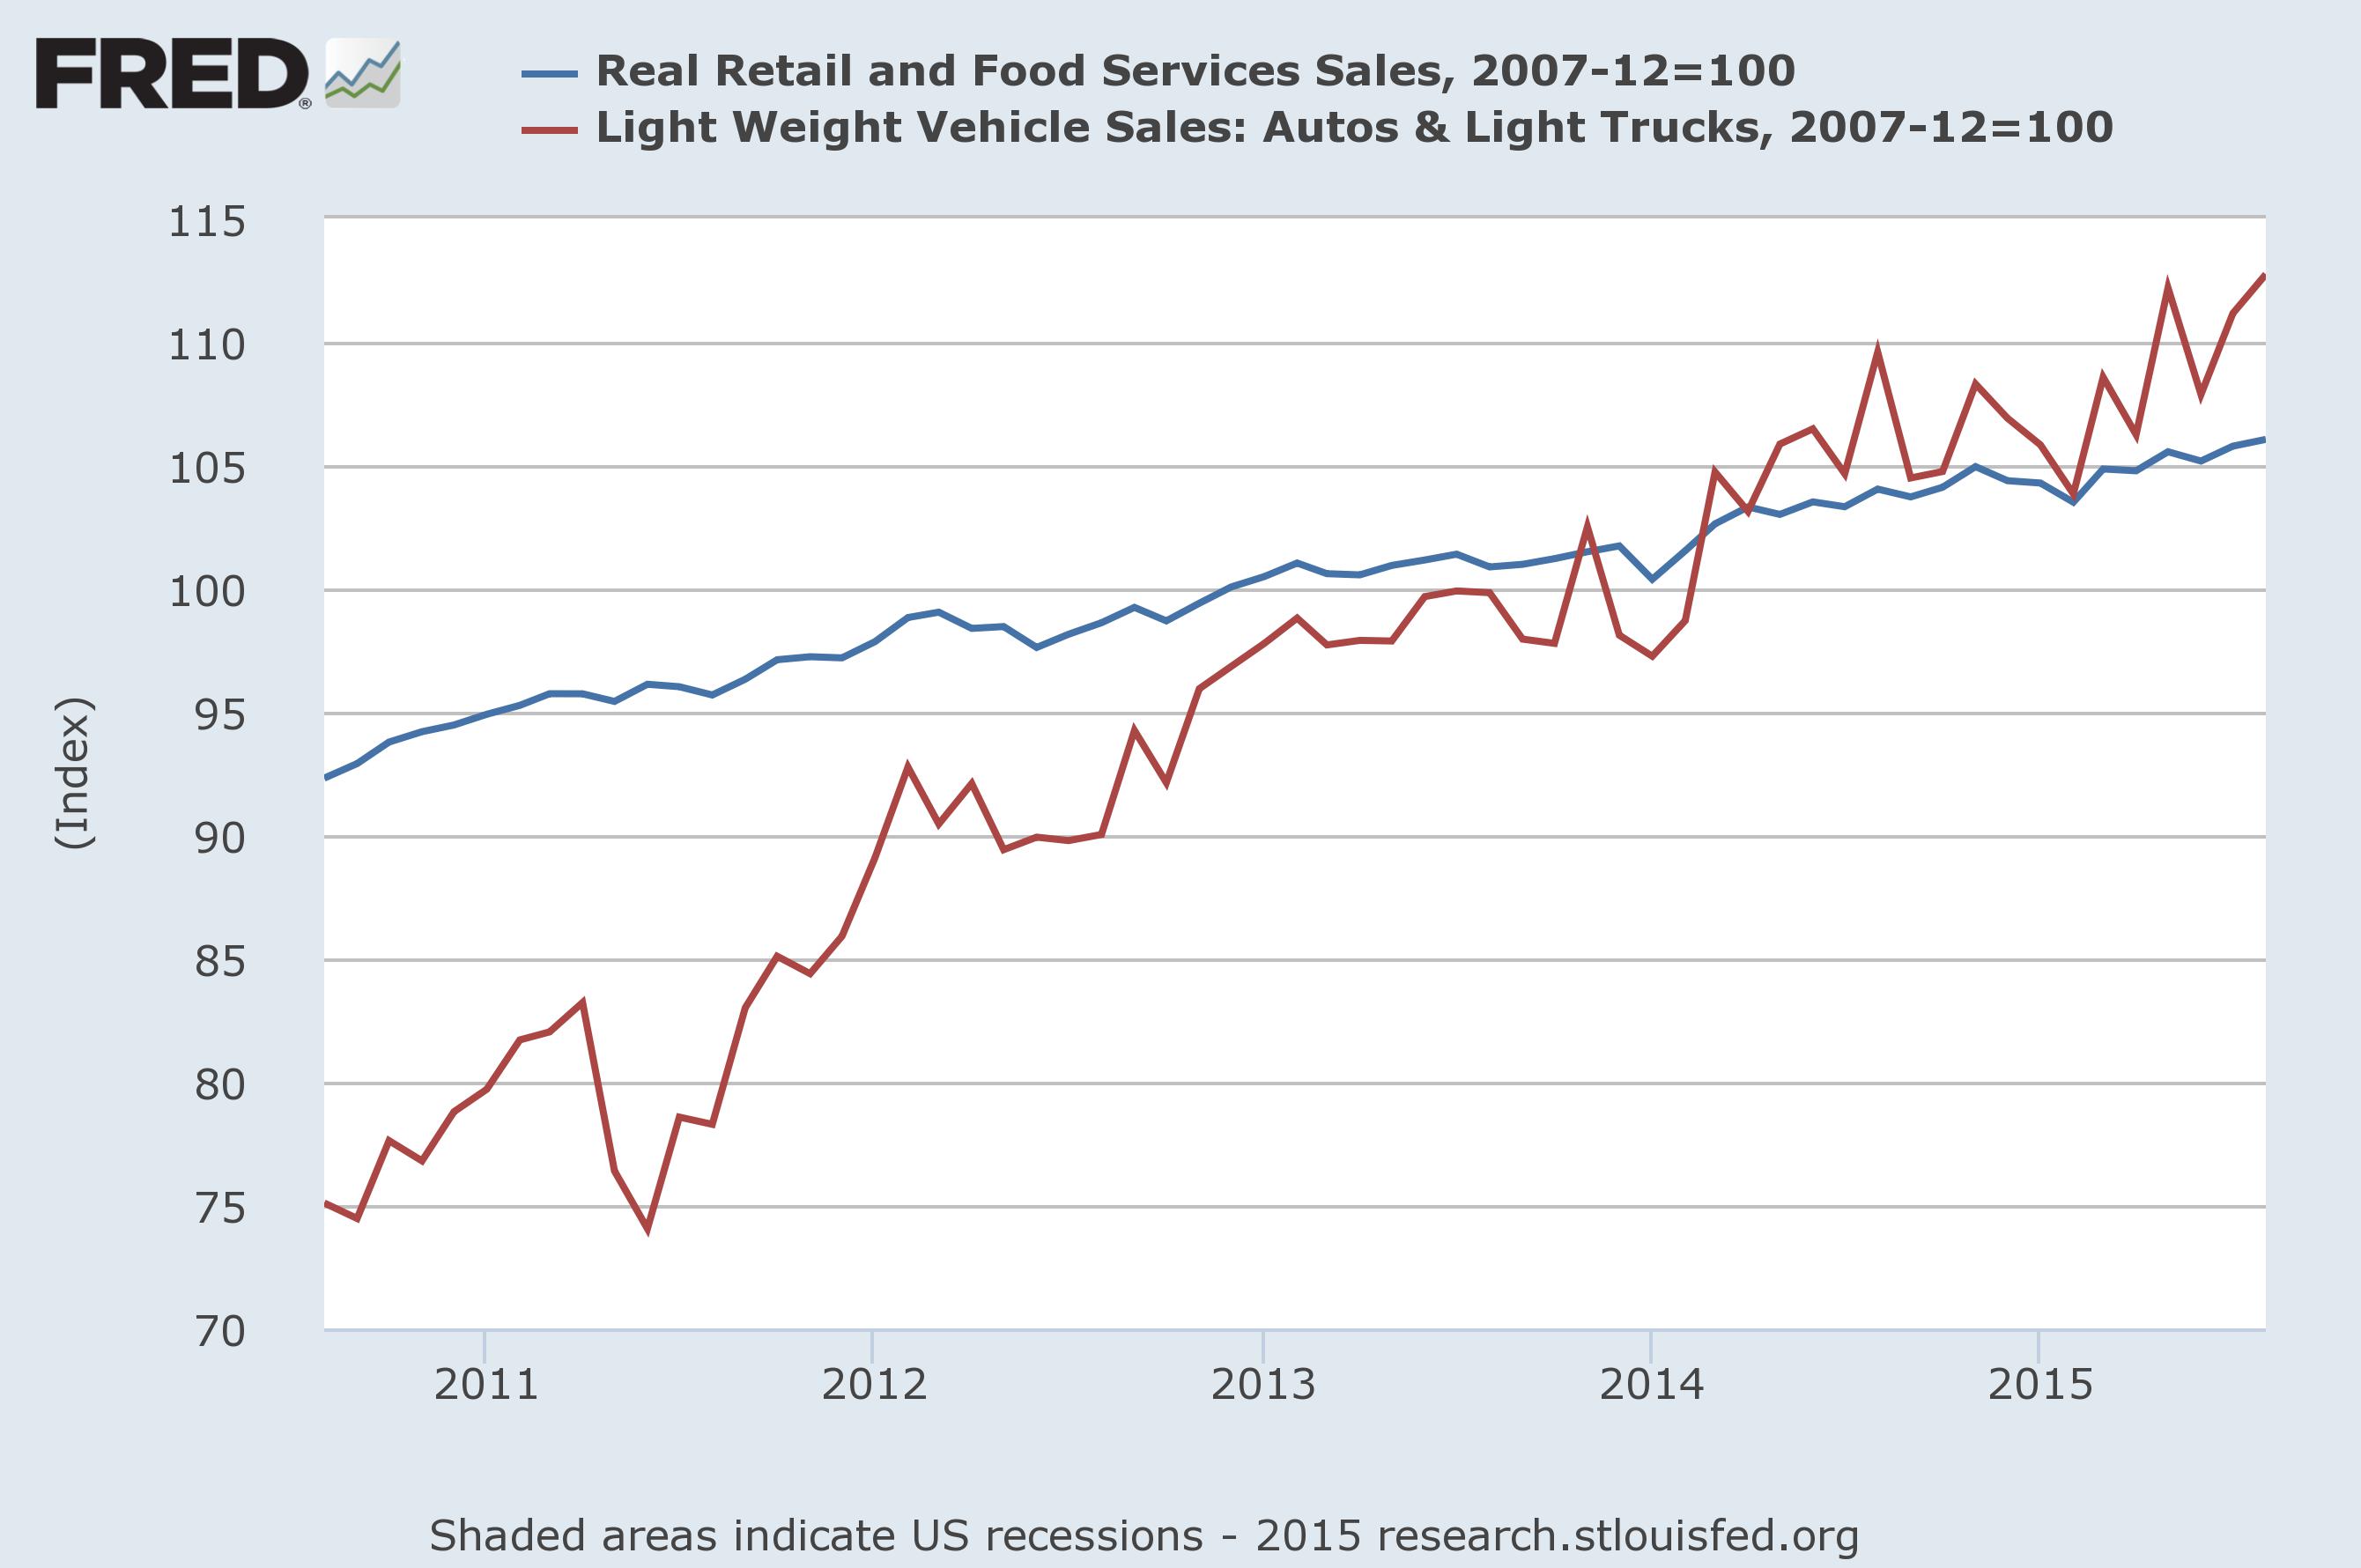
The car sales figure is particularly important; consumers have to take on loans to buy cars and they don’t do that unless they have some level of confidence in the future.
Industrial production, another important coincident indicator, was down again, marking the fourth decrease in the last six months:
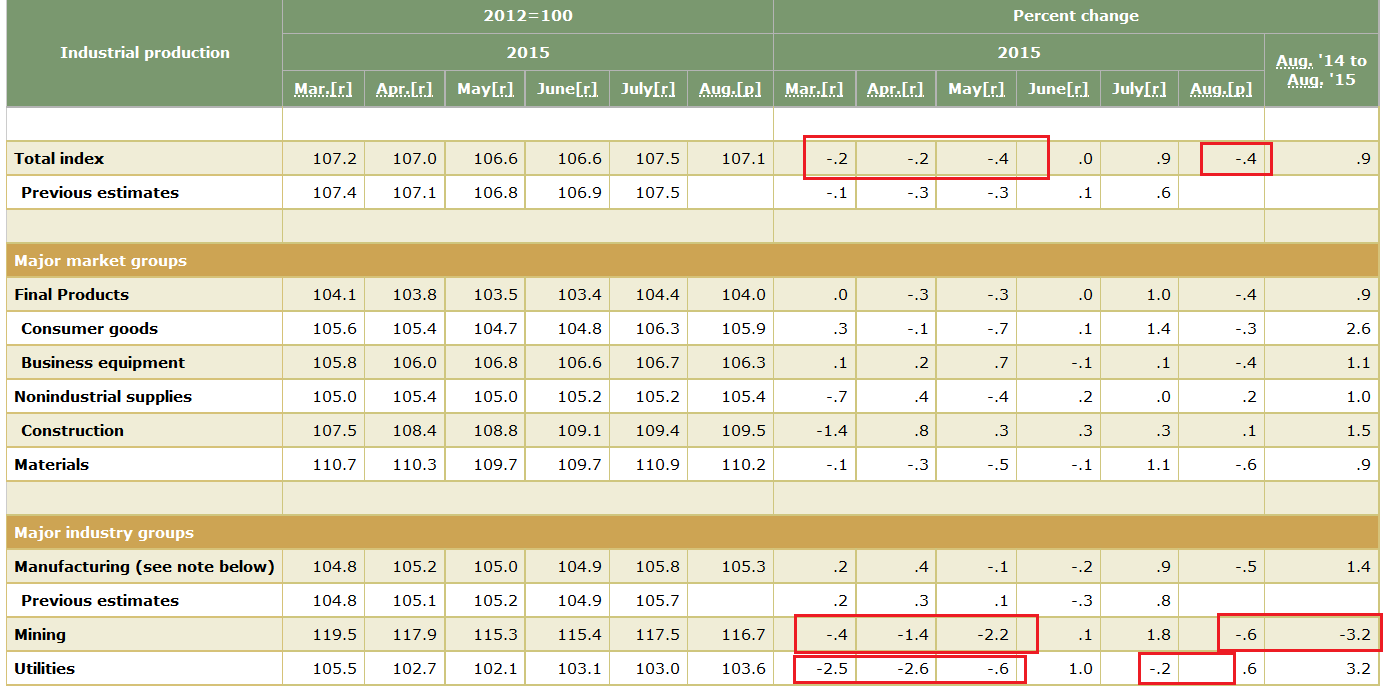
The best way to analyze the above table is from the bottom up. Mining dropped in four of the last six months, and at a sharp rate in April and May. Oil’s slowdown extended to ancillary industries such as materials extraction equipment and, to a lesser extent, consumer goods (laid-off oil workers purchase fewer toys). Utilities declined in March and April as inclement winter weather gave way to moderate spring temperatures. Not reflected in any of the data, but which the ISM new export orders allude to, is the slight export slowdown caused by the strong dollar. All three factors contributed to the industrial production slowdown. This trend will continue so long as oil remains in a bear market and the dollar is strong.
The Conference Board released the latest U.S. leading and coincident indicators, which each increased .2%. Let's start by looking at the LEI components:
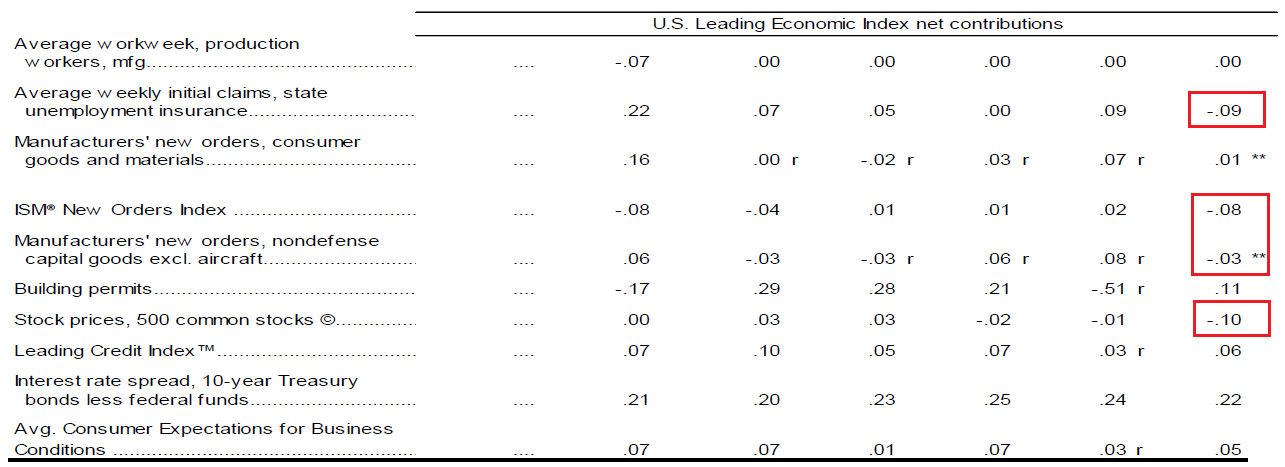
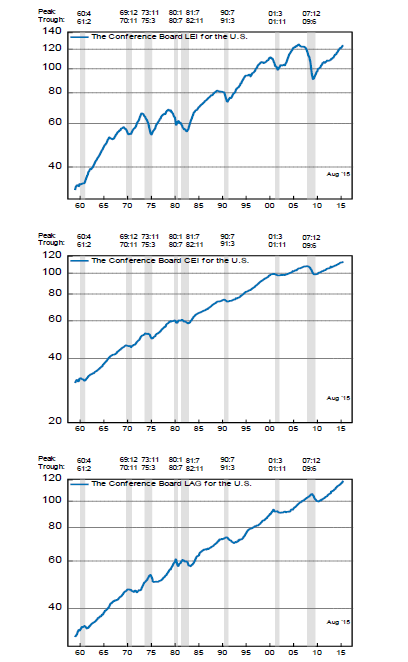
Manufacturing orders (see discussion above) were the primary source of weakness. Because weekly initial unemployment claims are at historically low levels, they will continue to provide weakness to the index. Three of four CEIs increased last month:

As these three graphs from the Conference Board’s report show, all three indexes are rising.
Economic Conclusion
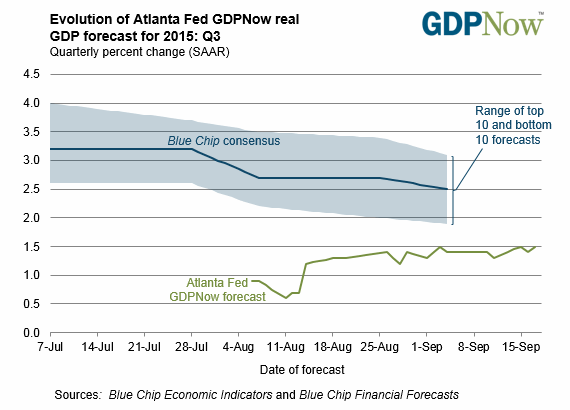
This week’s economic releases provide ample justification for the Fed’s “moderate” characterization of the U.S. economy. Retail sales, building permits and the LEIs all point to a modest expansion. The Atlanta Fed’s GDPNow confirms this assessment:
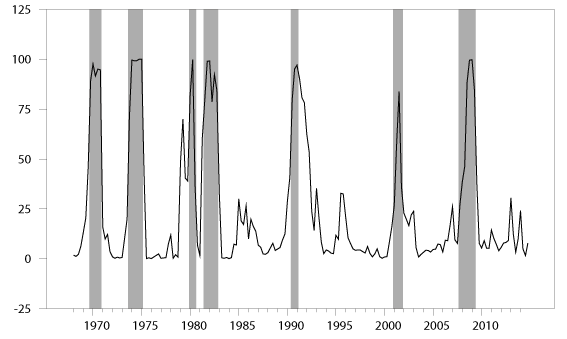
And their recession indicator’s latest readings is 13.3% -- a relatively low number:
The Markets
Once again, earnings projections are low; the following is from Zack’s Research:
The last earnings season was quite anemic, with growth rates in the negative and top-line weakness notably standing. Unfortunately, the earnings picture is unlikely to improve in the Q3 earnings season either, with total earnings for the S&P 500 index expected to be in the negative again. If two back-to-back quarters of GDP growth is the definition of an economic recession, then two quarters in a row of earnings declines would have to qualify as an earnings recession.
We will have to wait another few weeks for the earnings cycle to really get underway. But judging from current consensus estimates and reports from the likes of FedEx (NYSE:FDX), the outlook isn’t very inspiring. Total Q3 earnings for the S&P 500 index are expected to be down -5.6% from the same period last year on -4.4% lower revenues. This would follow earnings decline of -2.1% on -3.4% lower revenues in the preceding quarter.
Energy remains the biggest drag in Q3, as has been the trend in recent quarters, with total Energy sector earnings expected to be down -65% on -36.6% lower revenues. Excluding this Energy sector drag, earnings growth for the remainder of the S&P 500 index would be up +1.6% on +0.8% revenues.
Energy is no doubt a big drag, but there isn’t much growth momentum in other sectors aside from Finance and Medical, with earnings growth for half of the 16 Zacks sectors expected to be in the negative. Finance is expected to have another positive quarter, with total earnings for the sector expected to be up +8.8% from the same period last year. Excluding the contribution from the Finance sector, total earnings for the S&P 500 index would be down -8.9% from the year-earlier period.
Although recent anemic oil sector financial numbers grabbed the financial media’s attention, top and bottom line weakness is more widespread. According to Zacks, after they adjusted for non-recurring and one-time items, second quarter S&P 500 Y/Y revenue growth was -3.4%. Ex-finance, the number was -4.2% and ex-oil the gain was only 1.3%. After excluding the oil sector’s 3rd quarter projections, top line growth estimates are a paltry .8%. And they currently project half of the sectors to report third quarter revenue declines. In fact, the above excerpt uses the phrase “earnings recession” to describe the potential 3Q situation. And this is occurring when the market is expensive; the SPDR S&P 500 (NYSE:SPY) and PowerShares QQQ Trust Series 1 (NASDAQ:QQQ) current the estimated PE ratios are 21.17/21.65 and 16.52/19.67, respectively.
And expensive market and weak earnings projections create a difficult fundamental backdrop for a technically challenged market:
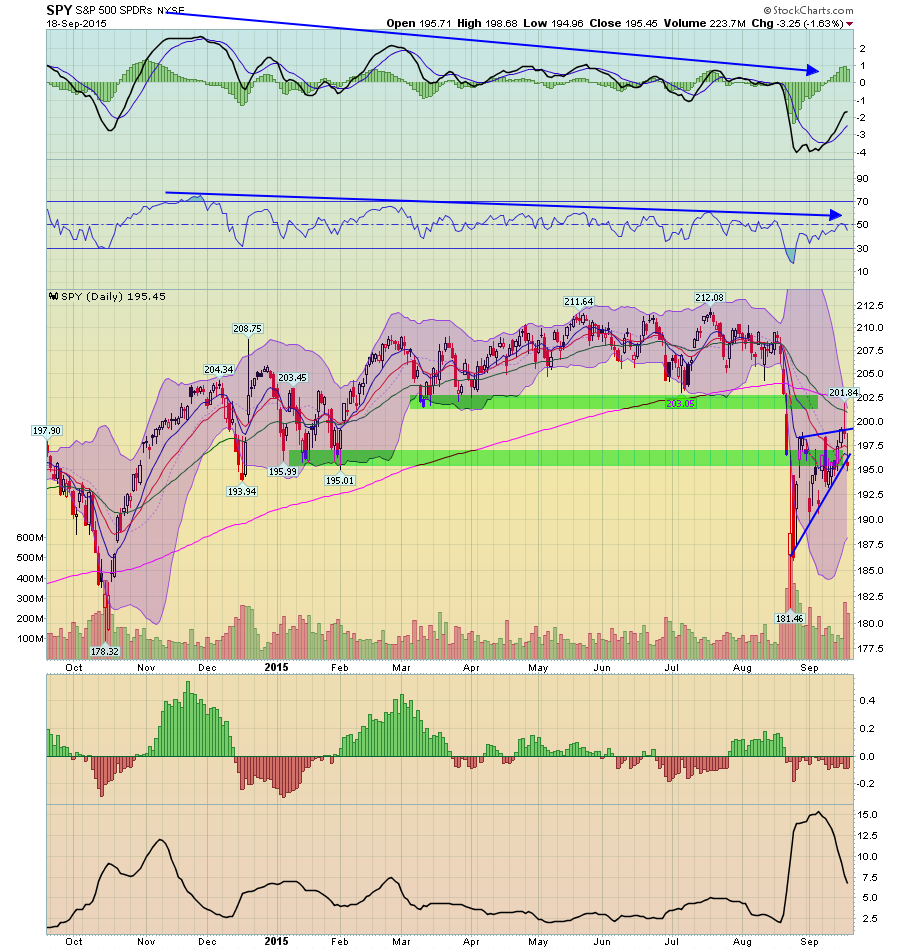
After falling through the 200 day EMA and the 202-203 level, prices now form an upward sloping wedge. But the shorter EMAs are below the longer EMAs with weak momentum and relative strength numbers adding to the technical problems.
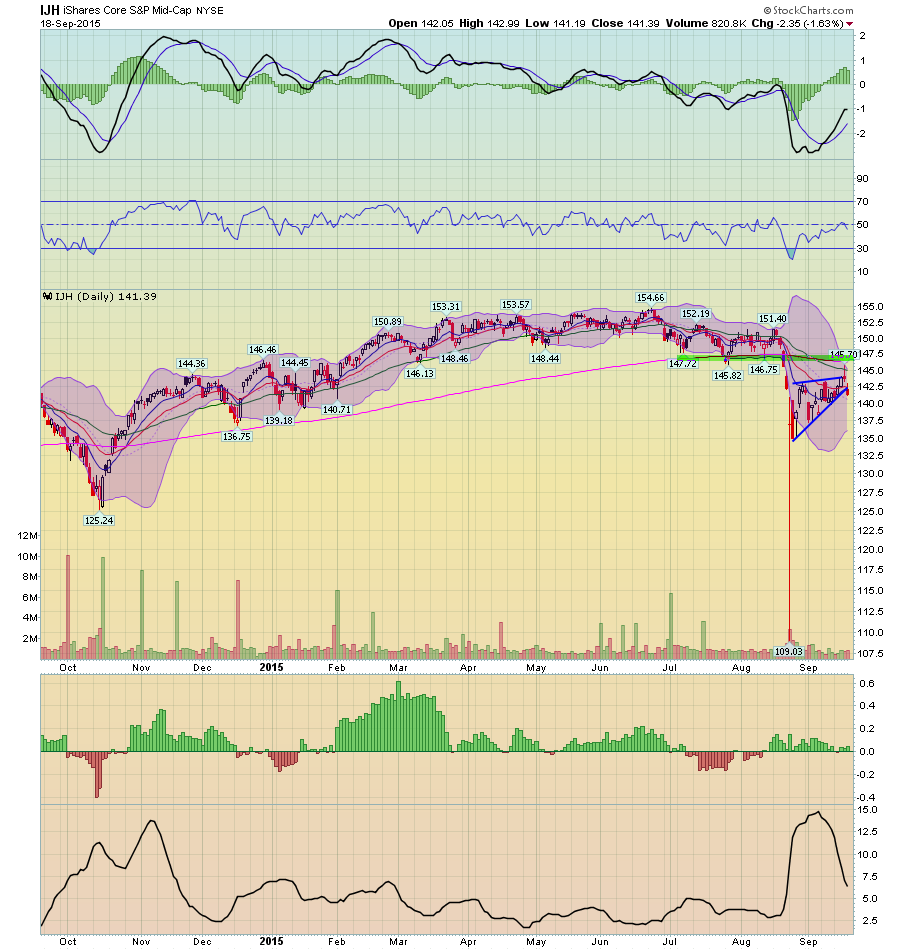
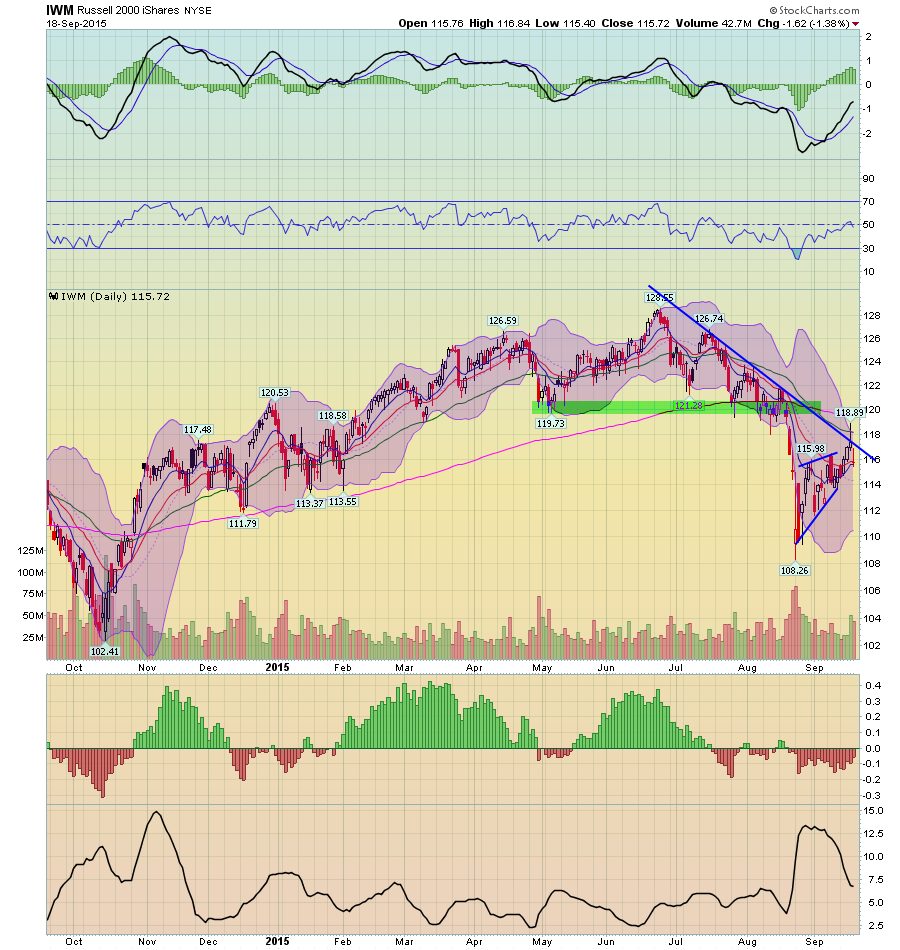
Mid and small caps share the same basic chart problems.
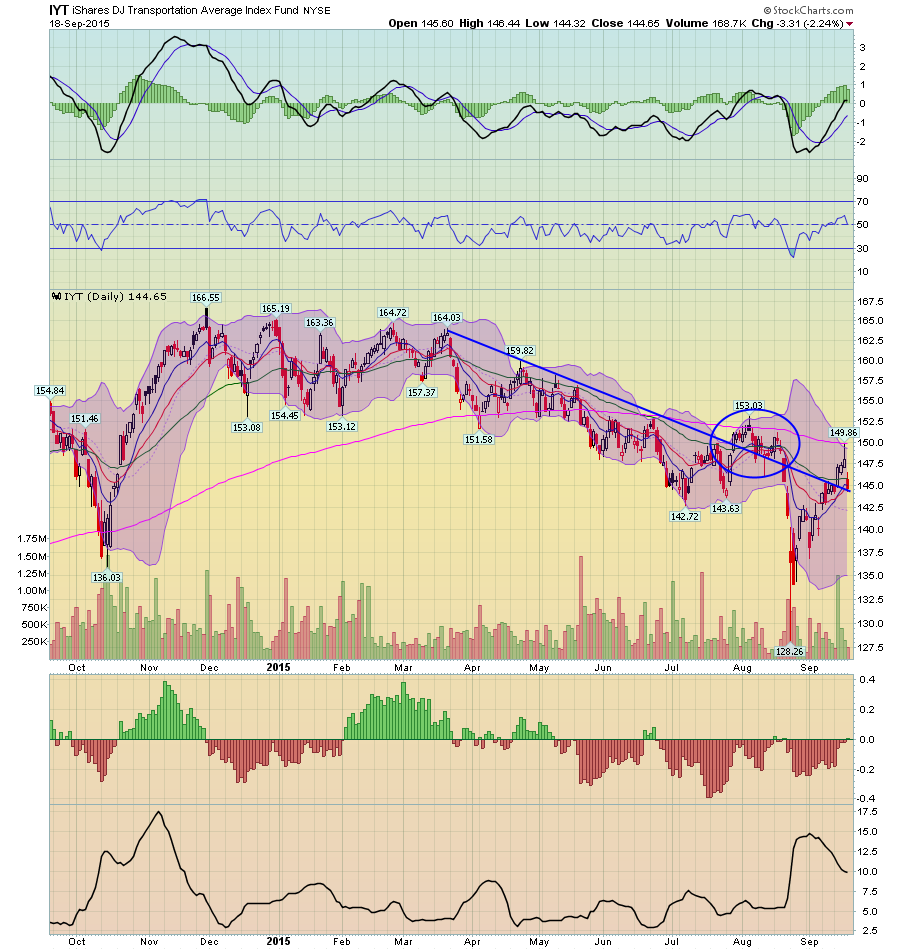
And it appears the transports are about to move through their top line downward sloping trend line a second time.
Conclusion
The oil sector slowdown and strong dollar continue to provide slight headwinds. But the core US “moderate” growth story remains. The markets, however are still expensive. And with a second consecutive quarter of weak revenue growth a distinct possibility, a solid and sustained upside move that eliminates recent losses seems difficult at best.
