Housing news continues to provide bulls with ample ammunition. Permits, starts and existing are all encouraging. But the leading indicators show the negative impact of the industrial recession, as new orders and hours worked contributed to this month’s .2% contraction. While the markets rallied, they did so against a background of declining revenue and a weak 3Q GDP. This makes it difficult to view last week’s action as a sustainable advance.
The Economic Perspective
On the surface the US housing markets news was mixed, but with an important statistical caveat regarding housing permits, which decreased 5% M/M but were up 4.7% Y/Y. The expiration of a NY building incentive that spiked permits a few months ago may still be impacting this data series:
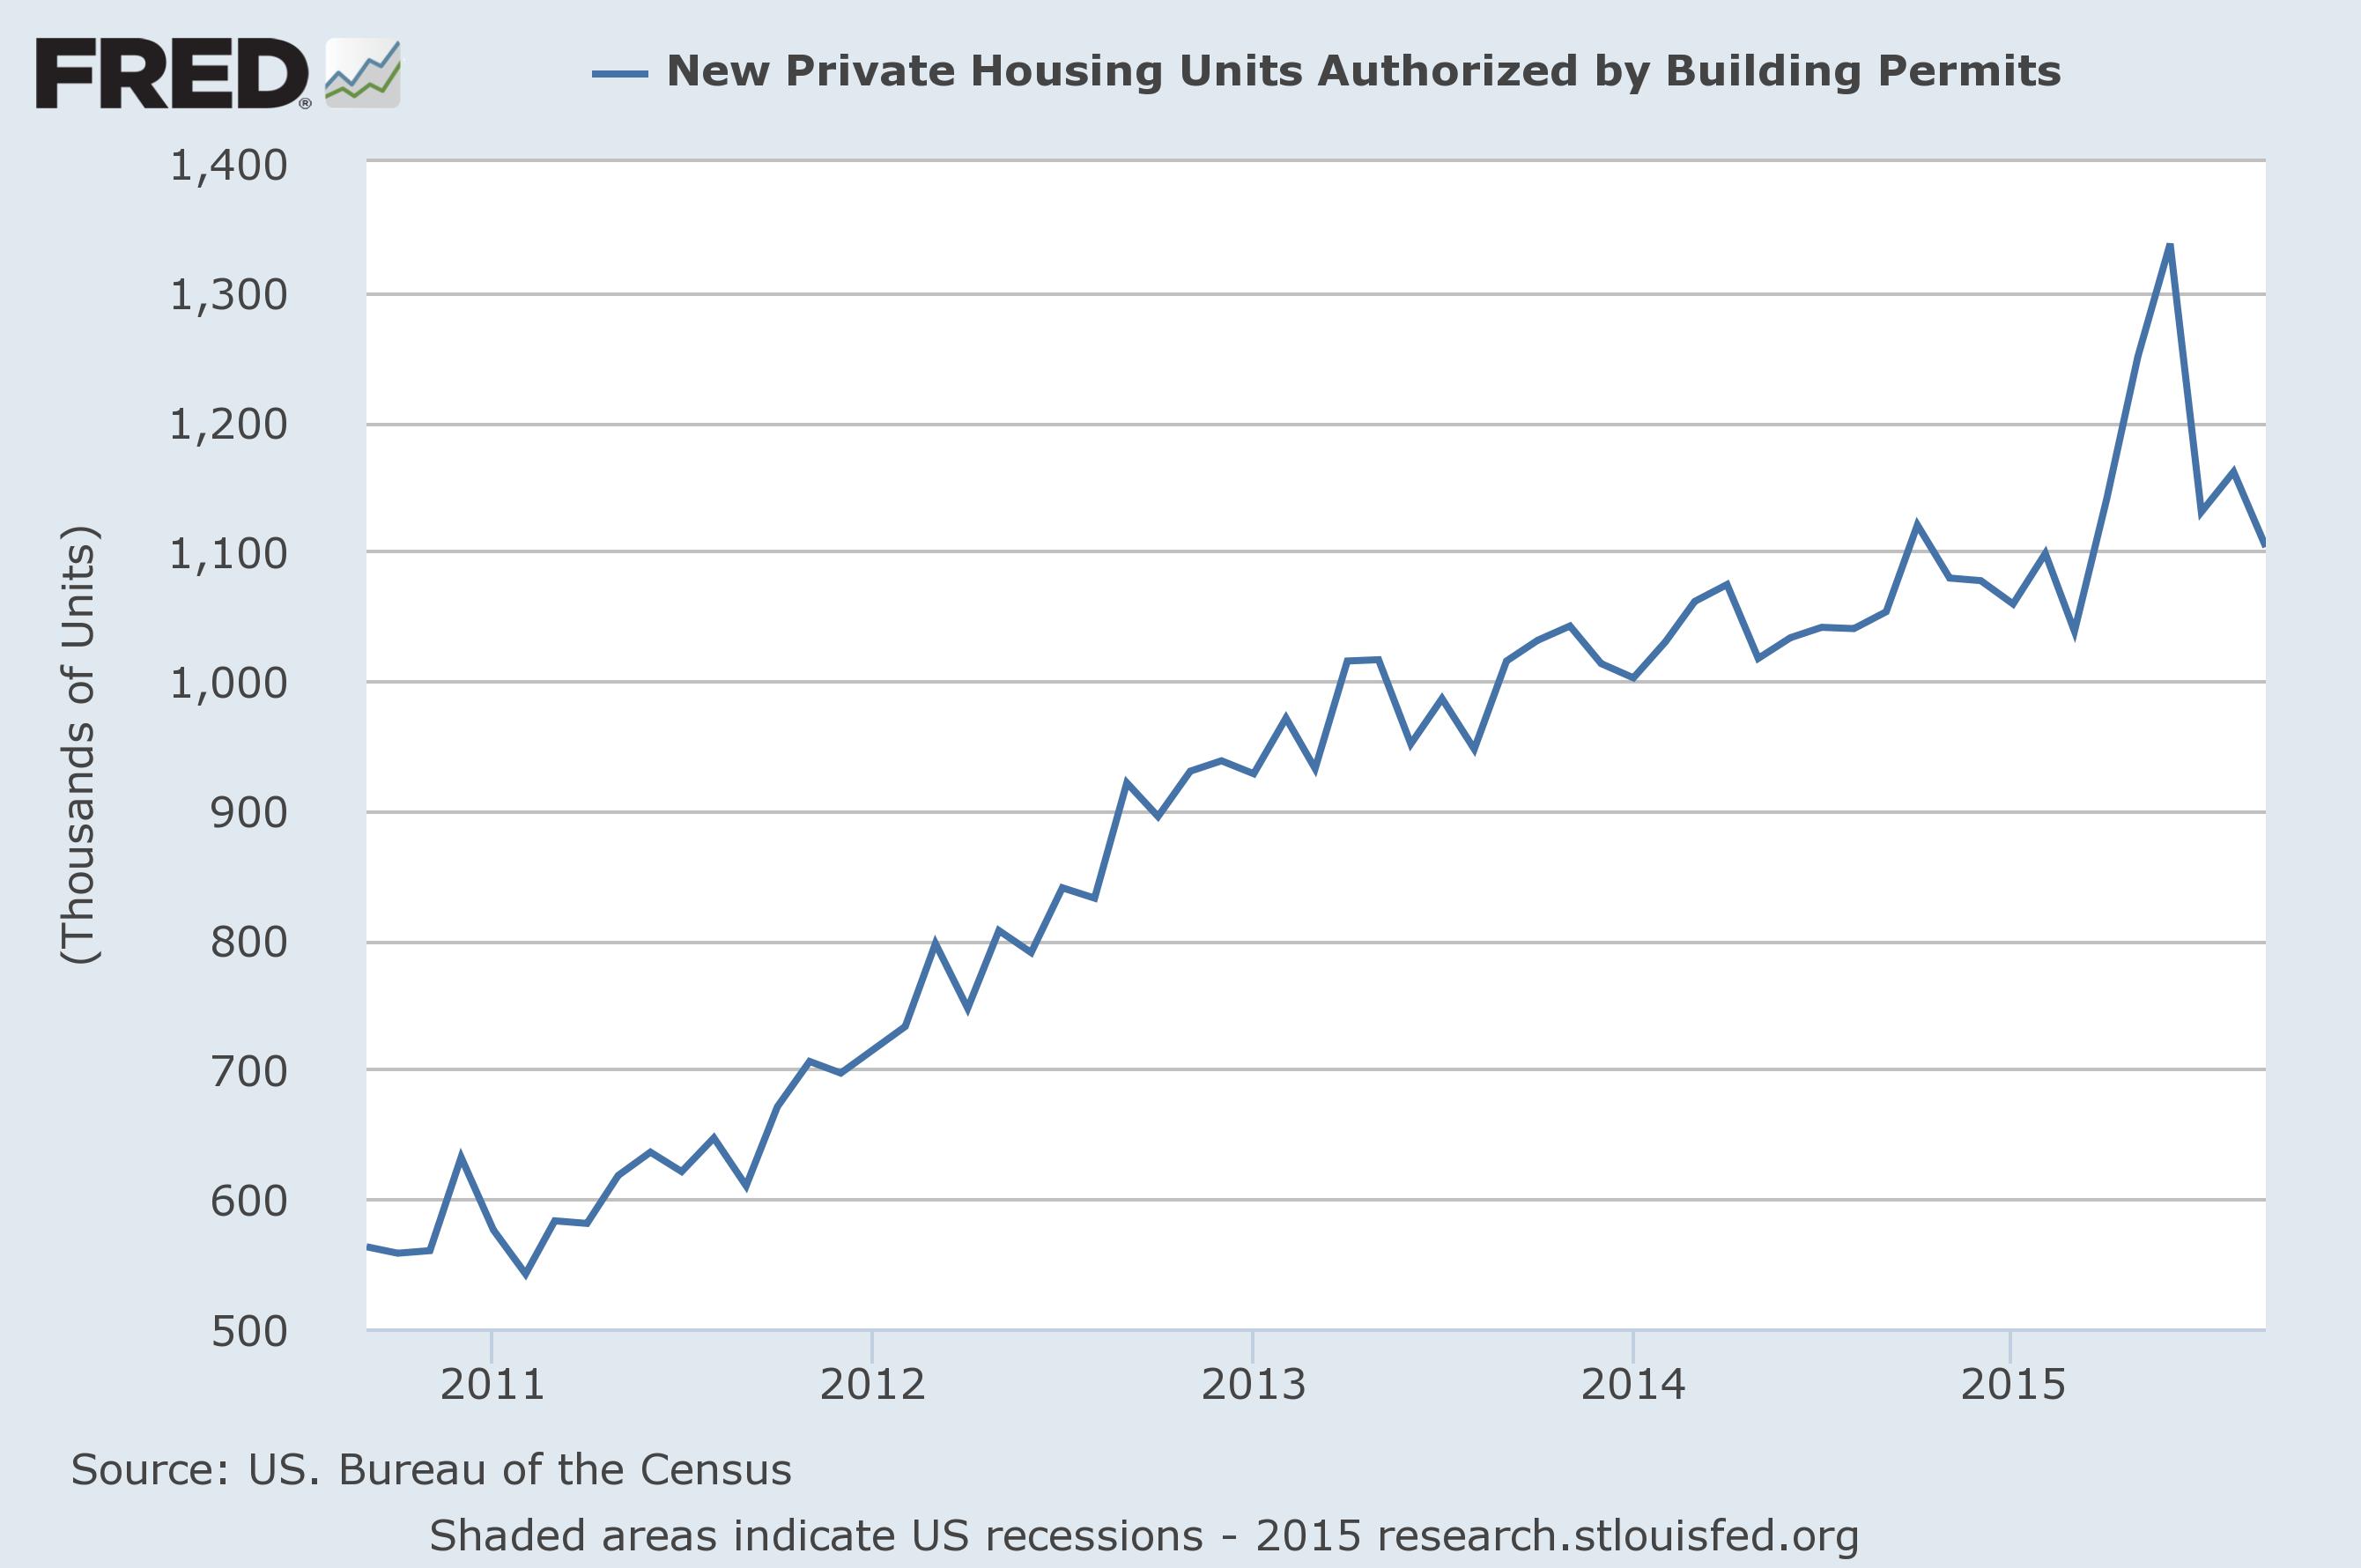
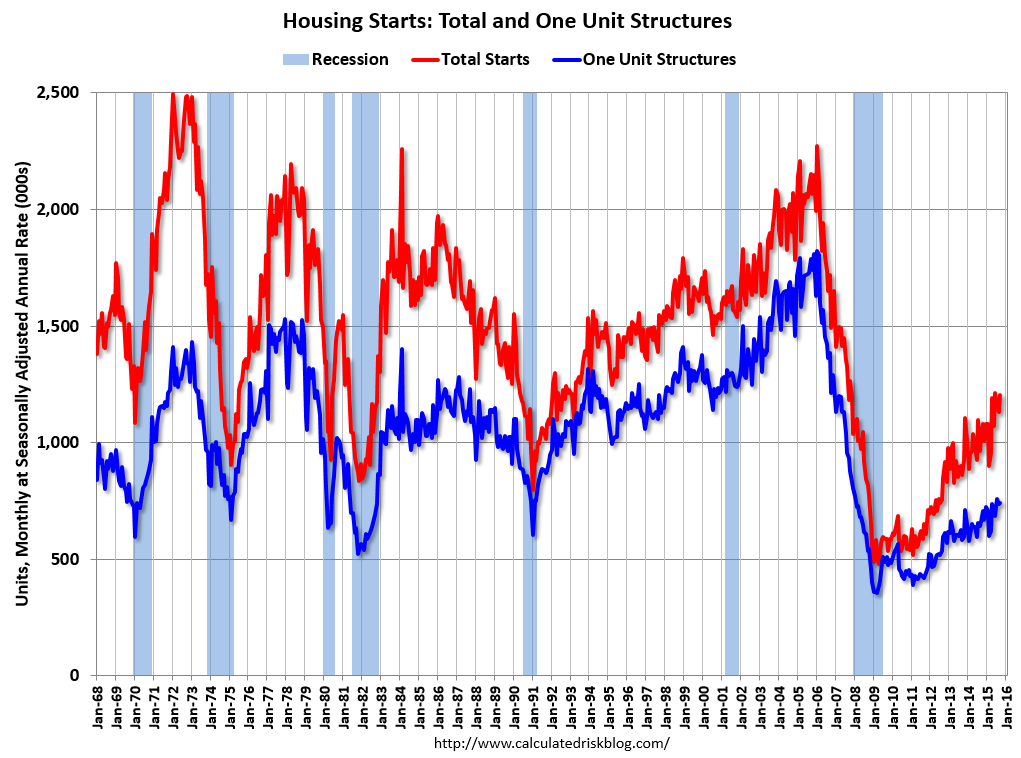
Assuming the expiration pulled permits forward, it’s logical to infer that the overall trend for the last three months would have been a more continual increase rather than a large spike. Housing starts were up 6.5% M/M and a very large 17.5% Y/Y. As this long-term graph from Calculated Risk shows, one unit starts remain at historically very low levels, meaning plenty of upside room remains for this leading indicator:
And finally, existing home sales increased 4.7% M/M and 8.8% Y/Y. Both starts and existing home sales are bullish. Sorting out the impact of the statistical anomaly regarding permits is a bit trickier. But with inventory low, it’s logical to assume permits will continue.
The Leading index declined .2%, and continues its 6 month slowdown:
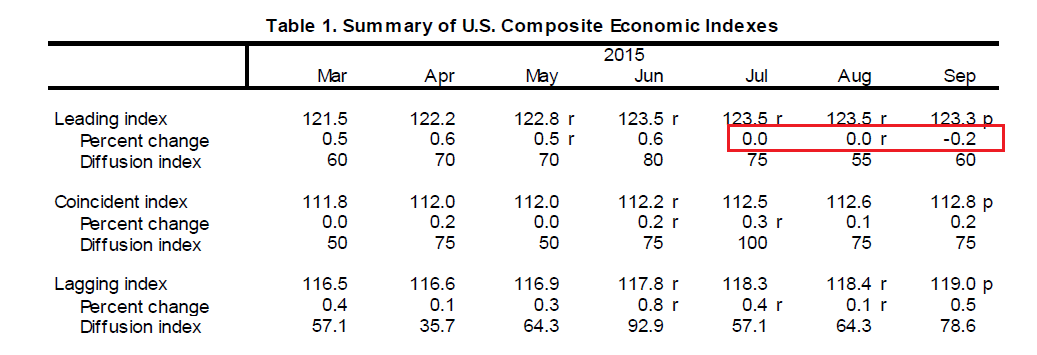
In March through June, the number printed between .5 and .6; for the last three months it was 0% -.2%. A closer look at its components reveals the negative impact of the shallow industrial recession:
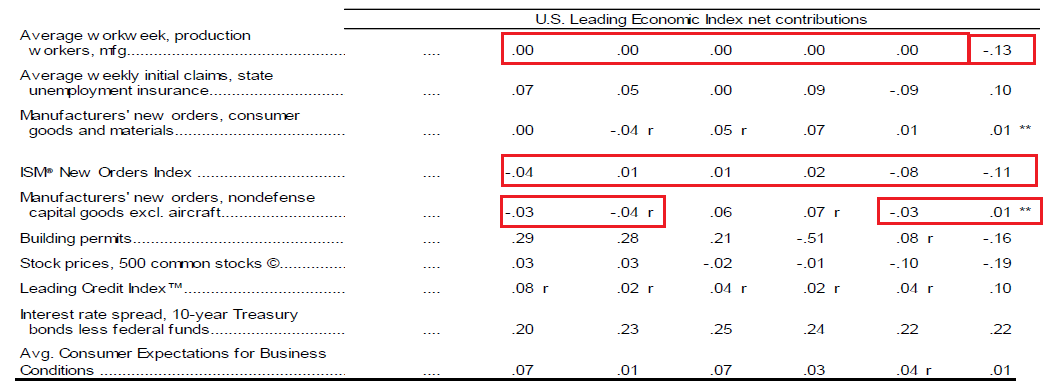
Over the last six months, the average workweek of production worker’s has either contributed 0% or subtracted from total LEI. New industrial orders have also been weak. All three indicators show the impact of the oil market slowdown, strong dollar and weaker international environment. It’s doubtful any of these macro-level events will reverse in the near future, meaning the LEIs will probably continue their overall weakening.
Overall 3Q GDP projections continue to be weak. The Atlanta Fed’s GDPNow model currently projects.9%, while Moody’s predicts 1.1%.
Economic Conclusion: The housing market continues to move forward, which is incredibly important news. So long as consumers are still buying durable goods such as autos and houses, the possibility of a recession is very remote. Unfortunately, the industrial recession continues, and with a weakening global growth environment, strong dollar and oil market collapse, it’s doubtful we’ll see a reversal anytime soon.
Market Analysis
The market is still expensive. According to the Wall Street Journal’s Market Data website, the (N:SPY)s/(O:QQQ)s current and forward PEs are 22.07/23.25 and 18.41/19.70, respectively. And according to Factset.com, revenue growth for the S&P 500 is declining:
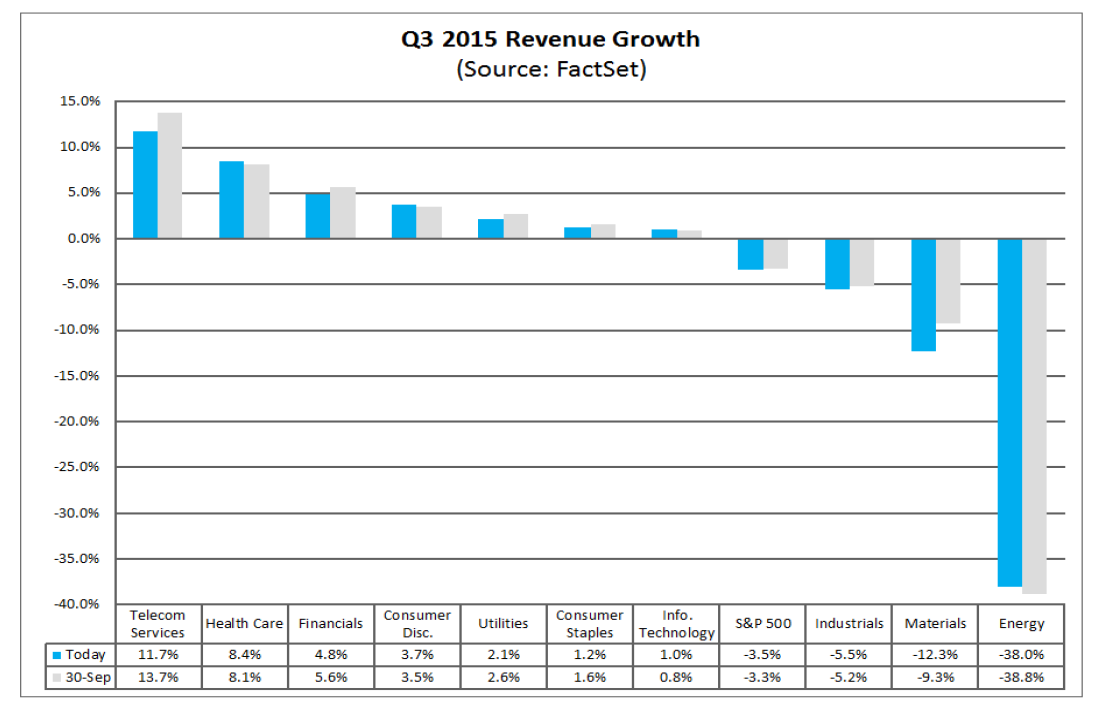
Granted, energy, basic materials and industrial are responsible for the declines. Other sectors such as health care and telecoms are growing at a strong clip. So far, at least, the industrial slowdown’s damage is contained. But a larger number of sectors has a majority of their constitute members reporting negative revenue surprises:
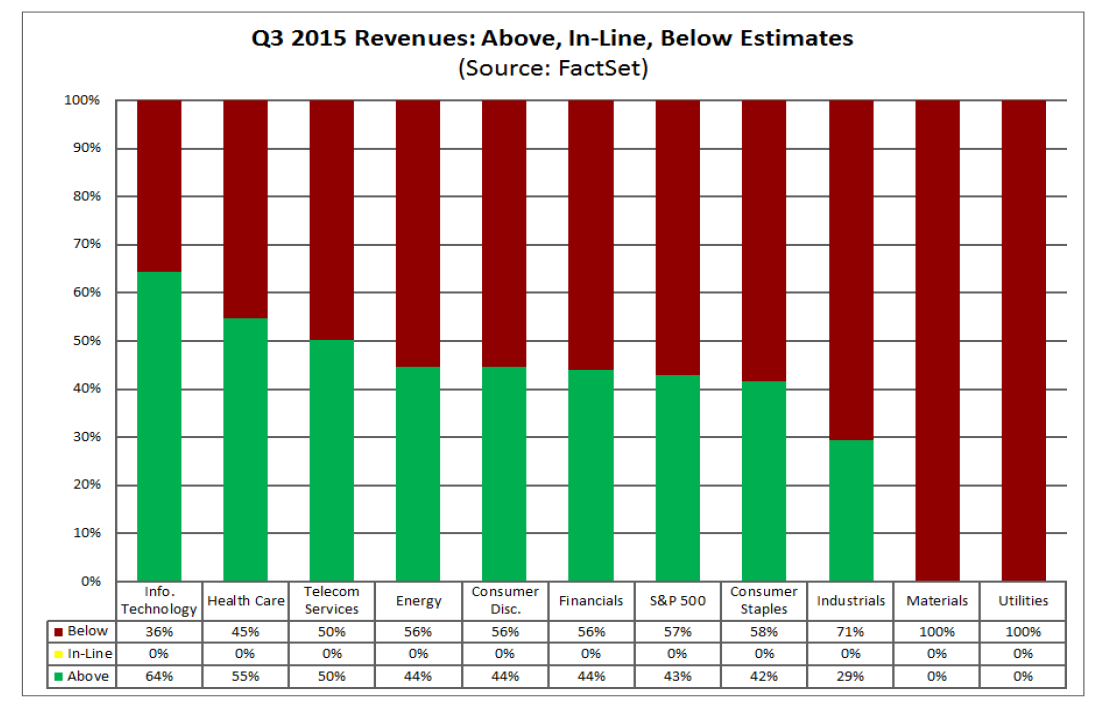
This raises fundamental concern going forward.
Most major markets rallied strongly last week:
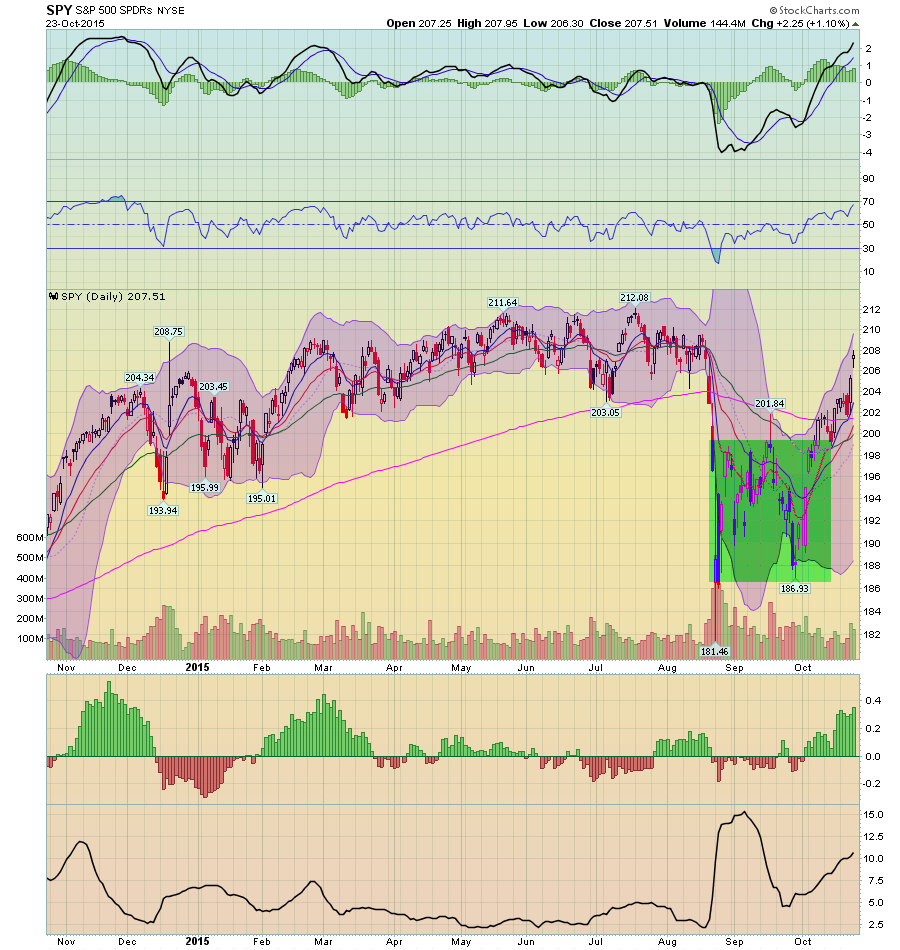
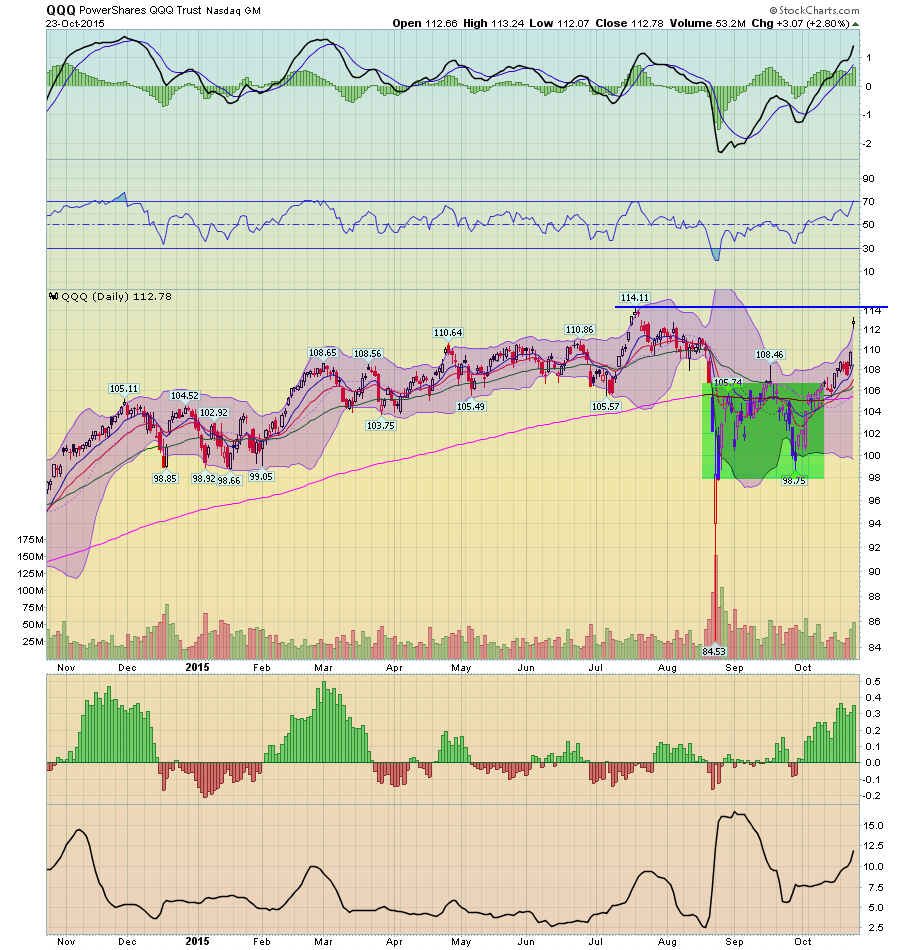
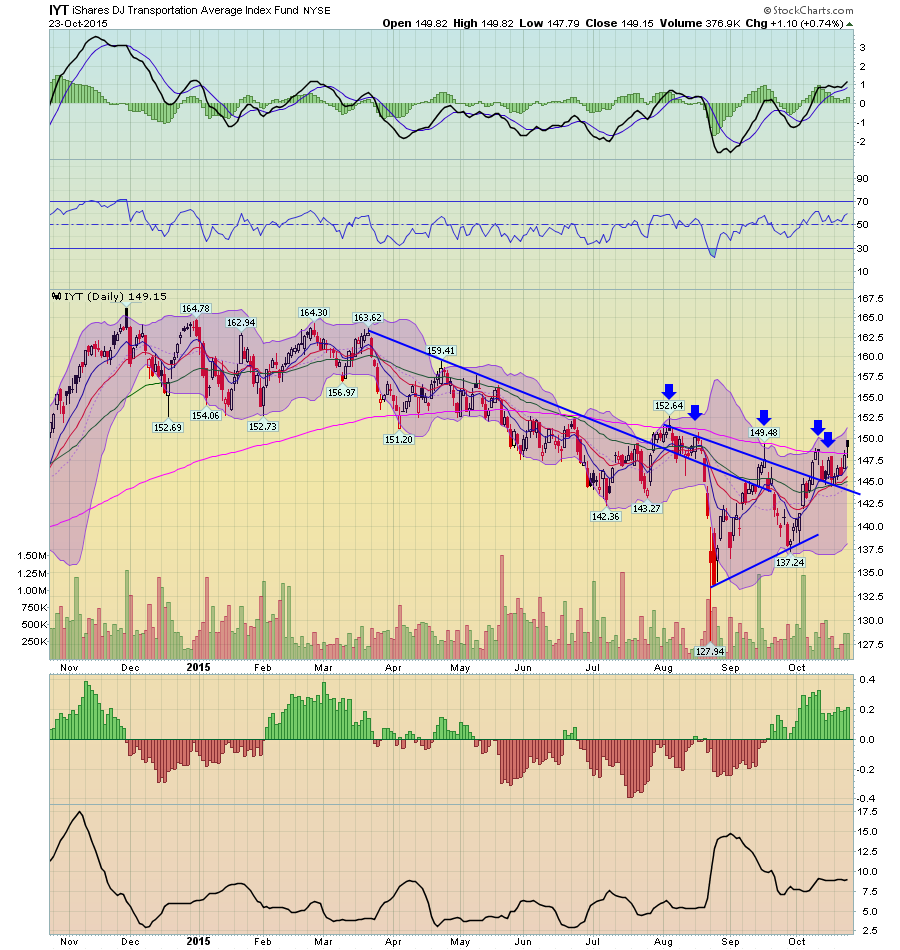
The SPYs (top chart) jumped sharply on Thursday when the ECB made its dovish announcement. Volume and momentum increased while prices moved through the 204-206 level. The index potentially printed a spinning top formation on Friday. The QQQs chart (middle) is very similar, except the upward momentum is stronger, with prices nearing previous highs. The transports (bottom chart) finally broke through the 200 day EMA – an important technical development. The only problem is the Russell 2000:
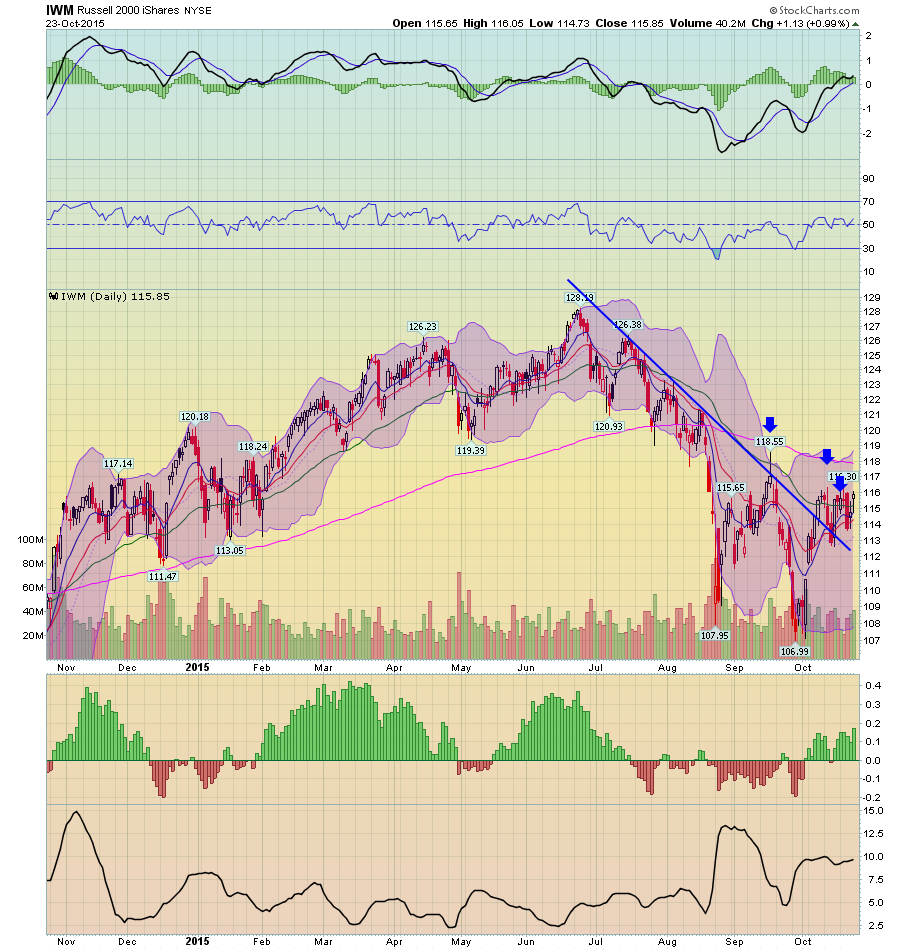
Prices continue to languish below the 200 day EMA. This is a bit perplexing. First, with a strong dollar, traders should be looking to companies with less international exposure – which is usually small caps. In addition, this market sector represents the true “risk on” trade; if it isn’t rising, it’s natural to question if we’re really seeing new commitment to a further advance.
While this week’s rally was encouraging, it’s important to remember it occurred in response to the potential for additional European – not US – easing. Additionally, the macro background continues to slightly weaken: it’s possible we’ll see a third consecutive quarter of revenue declines and a potential weak print for 3Q GDP. While the public statements from several Fed Governors indicates the potential for increased US central bank dovishness, no one as yet has proposed additional stimulus. Given the somewhat dim macro environment with zero to minimal additional Fed or Federal action, it’s difficult to see this rally as anything more than a temporary aberration in a middling market environment.

