The strongest news of the week was the upward revision of 2Q GDP from 2.3% to 3.7% (Q/Q). All sectors contributed. Personal consumption expenditures increased 3.1% with contributions from durable goods purchases (+8.2%) and non-durable goods (+4.1%). Residential construction increased 7.8% while non-residential was up 3.1%. Equipment was down .4%, but this can be attributed to oil sector’s weakness. Finally, exports increased 5.2%. Overall, this report was very encouraging, especially considering 1Q weakness.
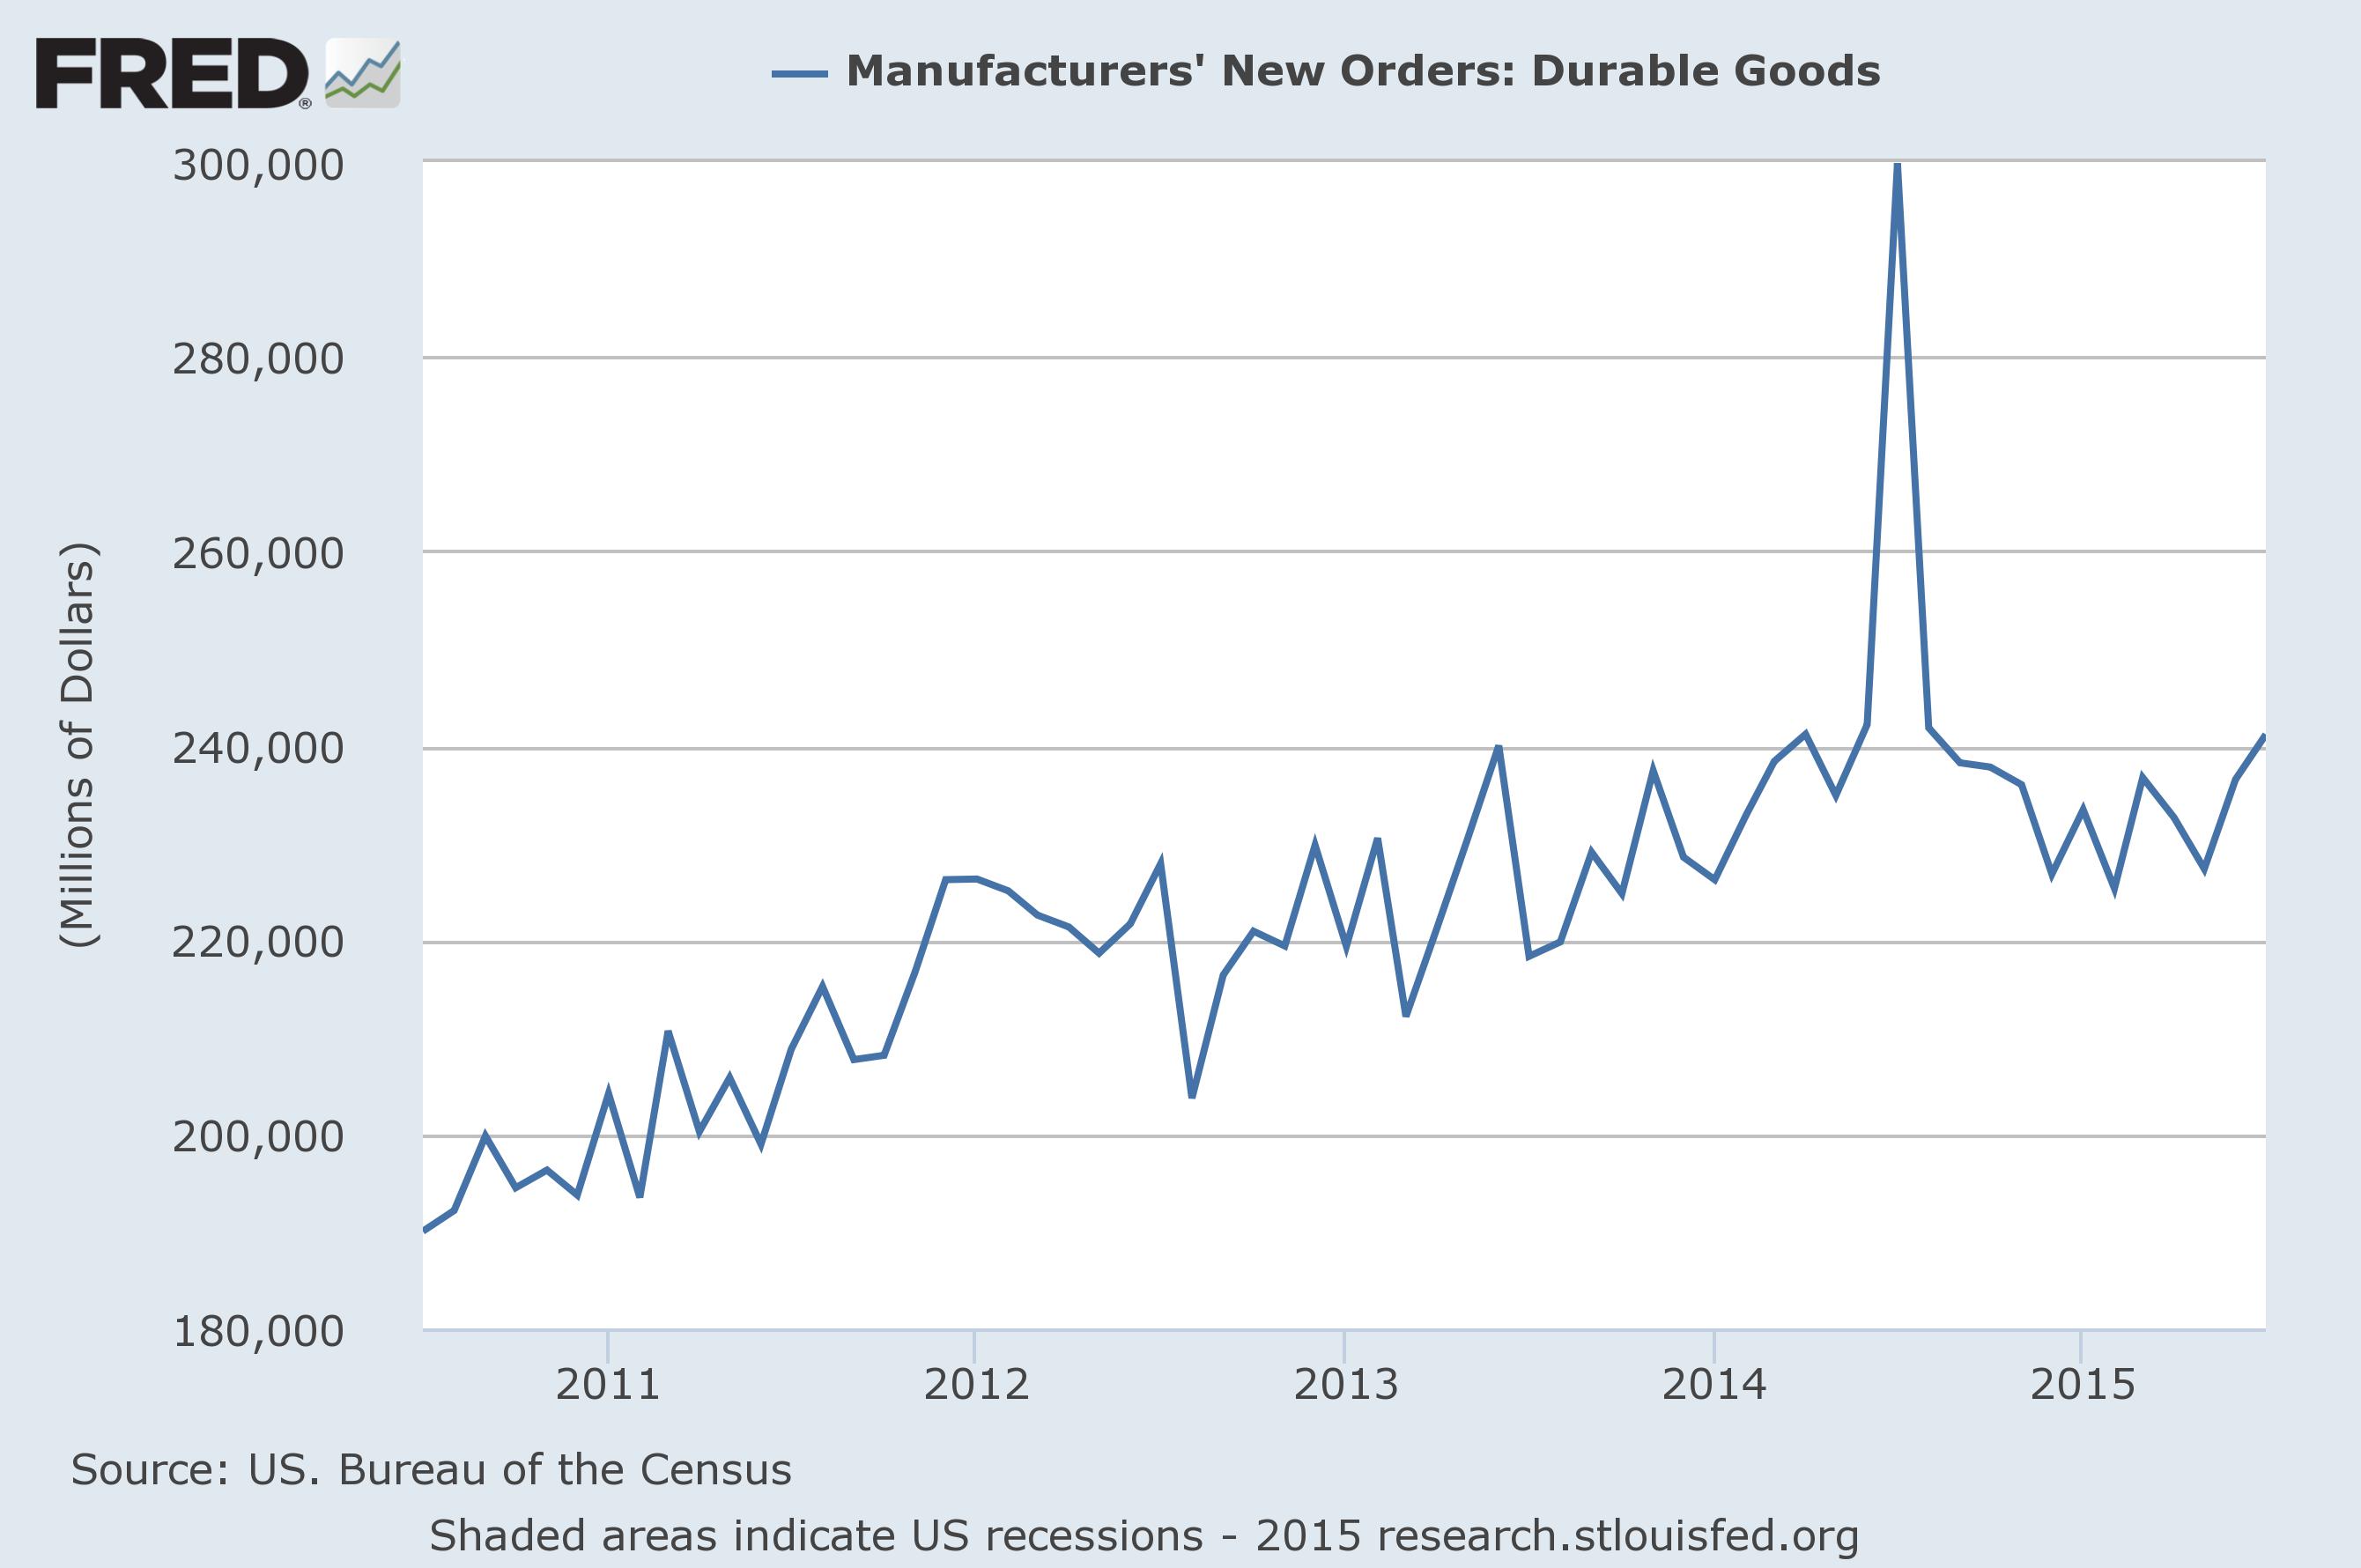
Durable goods also showed improvement, with total orders increasing 2%, while the number ex-transportation was up .6%. However, this data series continues to print between $230-$240 billion, indicating a certain level of malaise largely resulting from the strong dollar and weak oil:
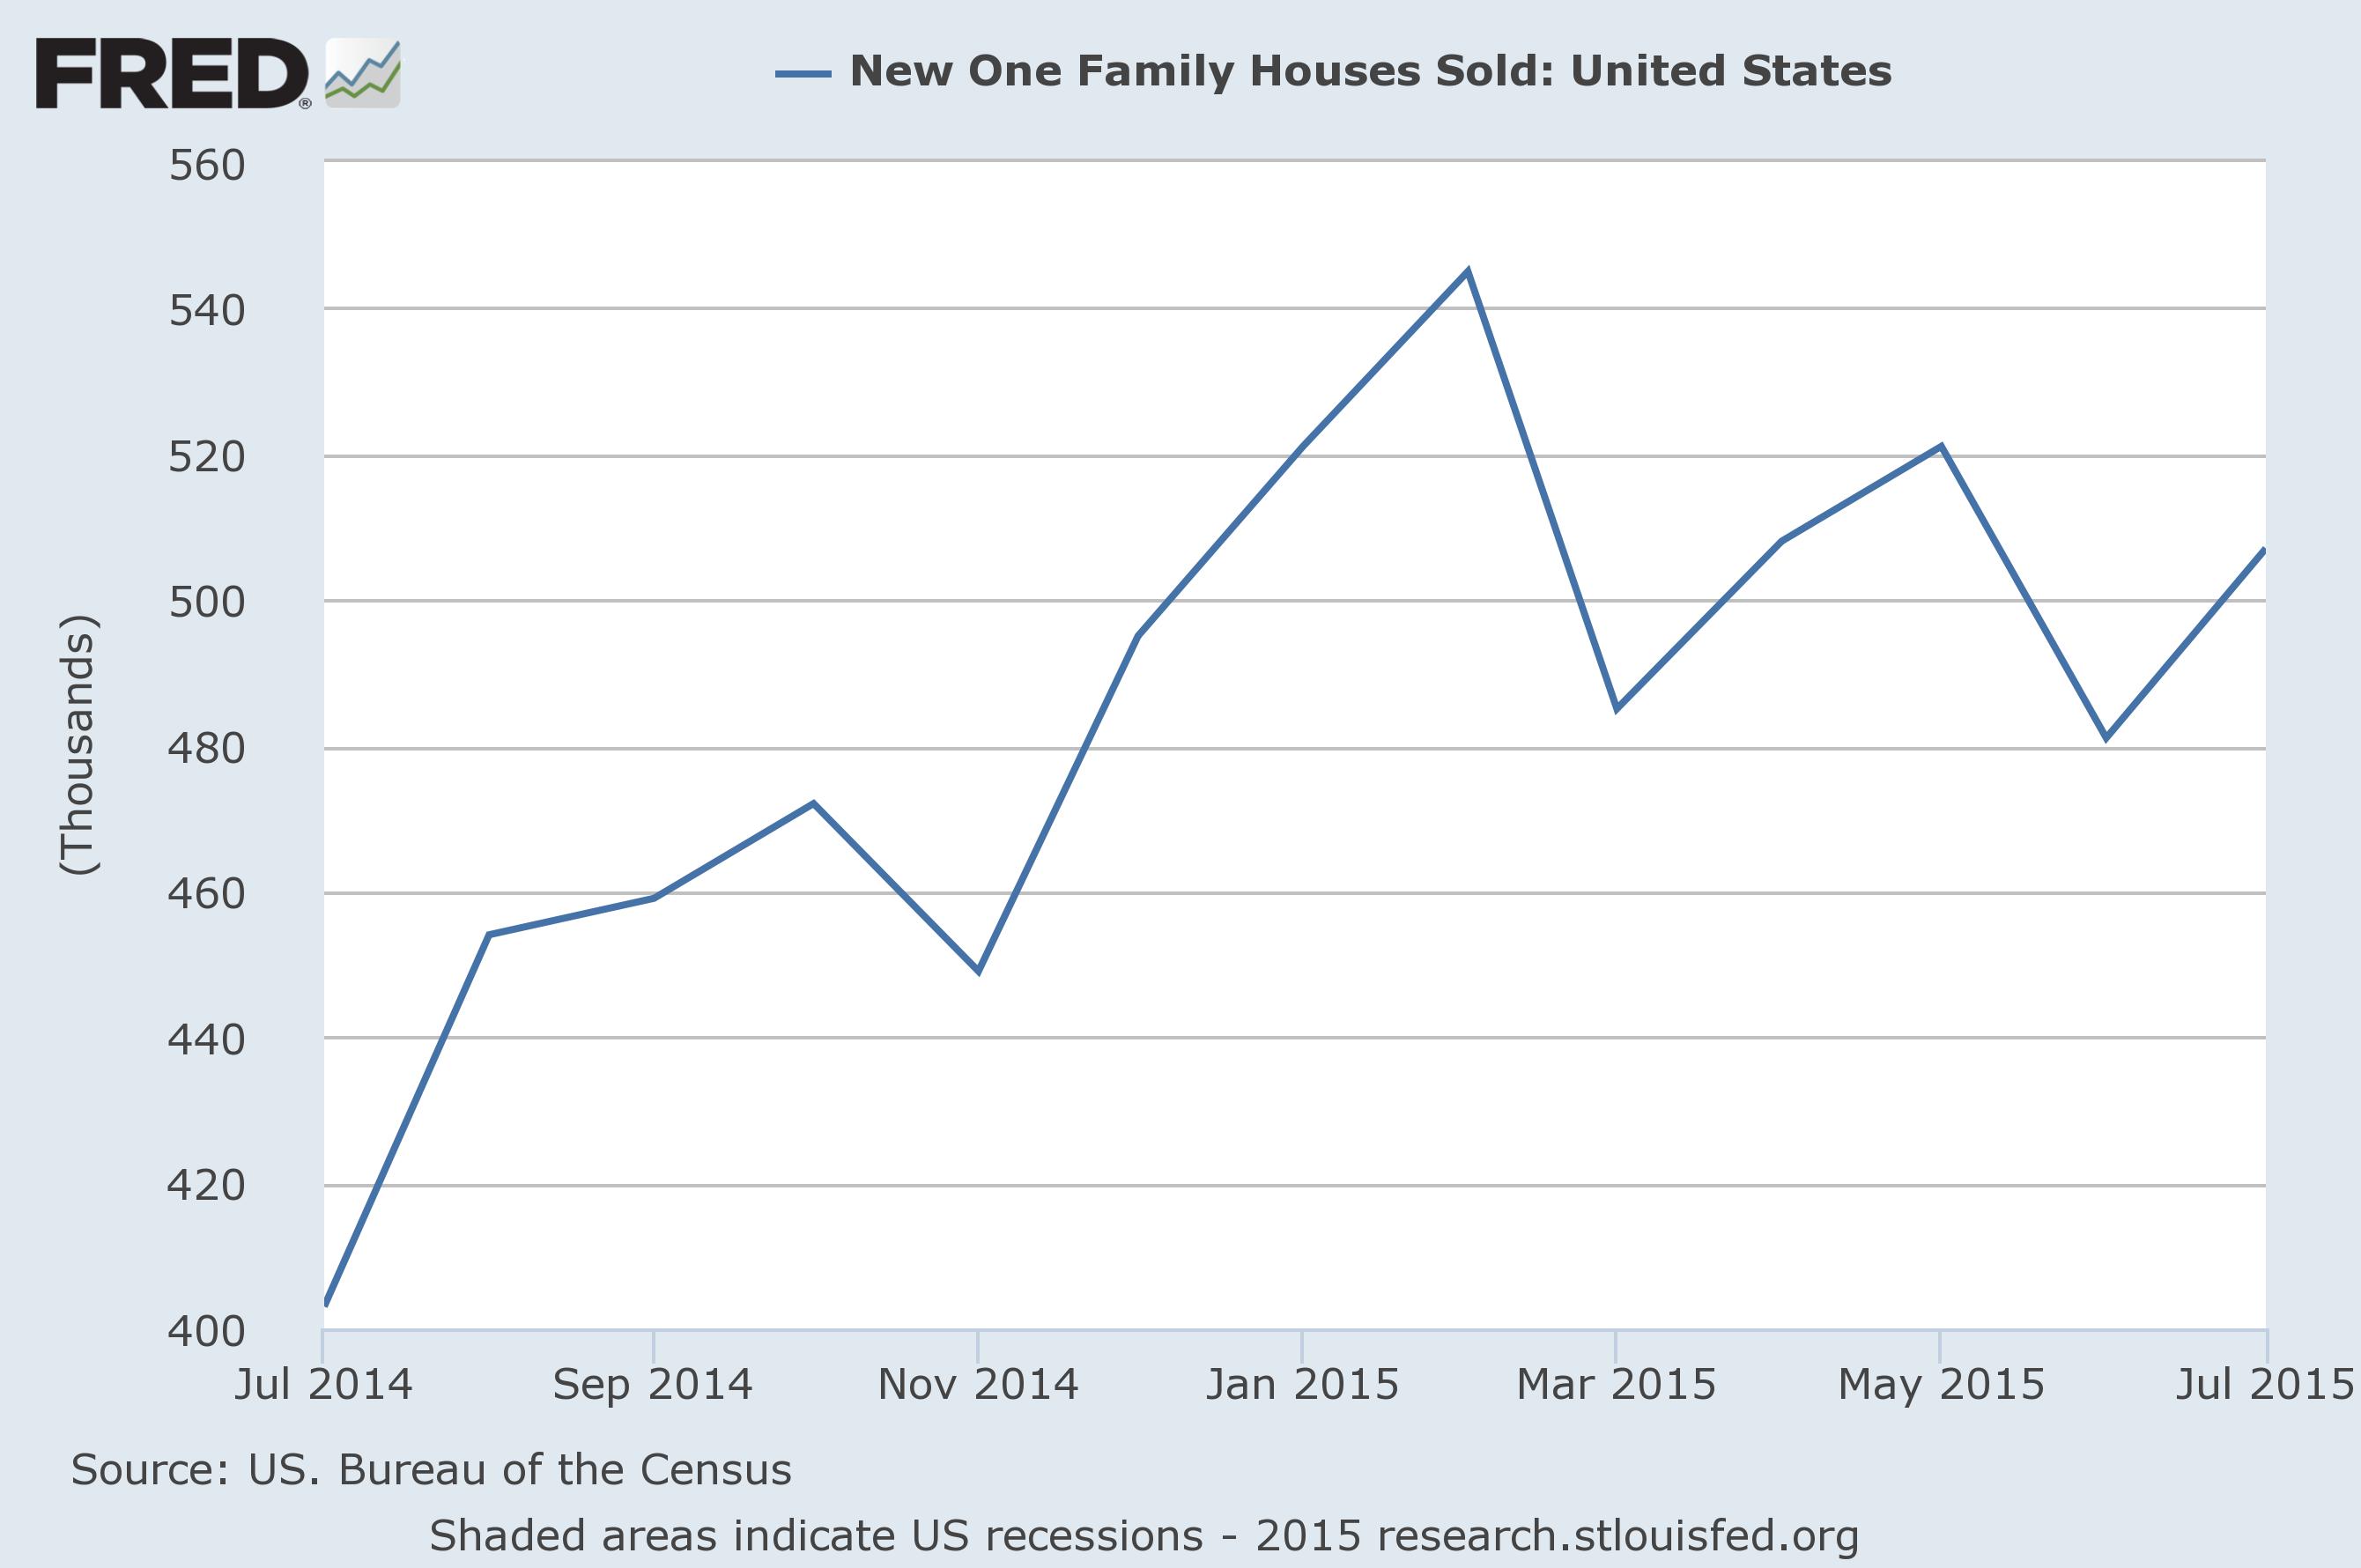
Finally, new home sales were up 5.4% from the previous month. As this graph from the Fred system shows, this data series has been moving sideways since the beginning of the year:
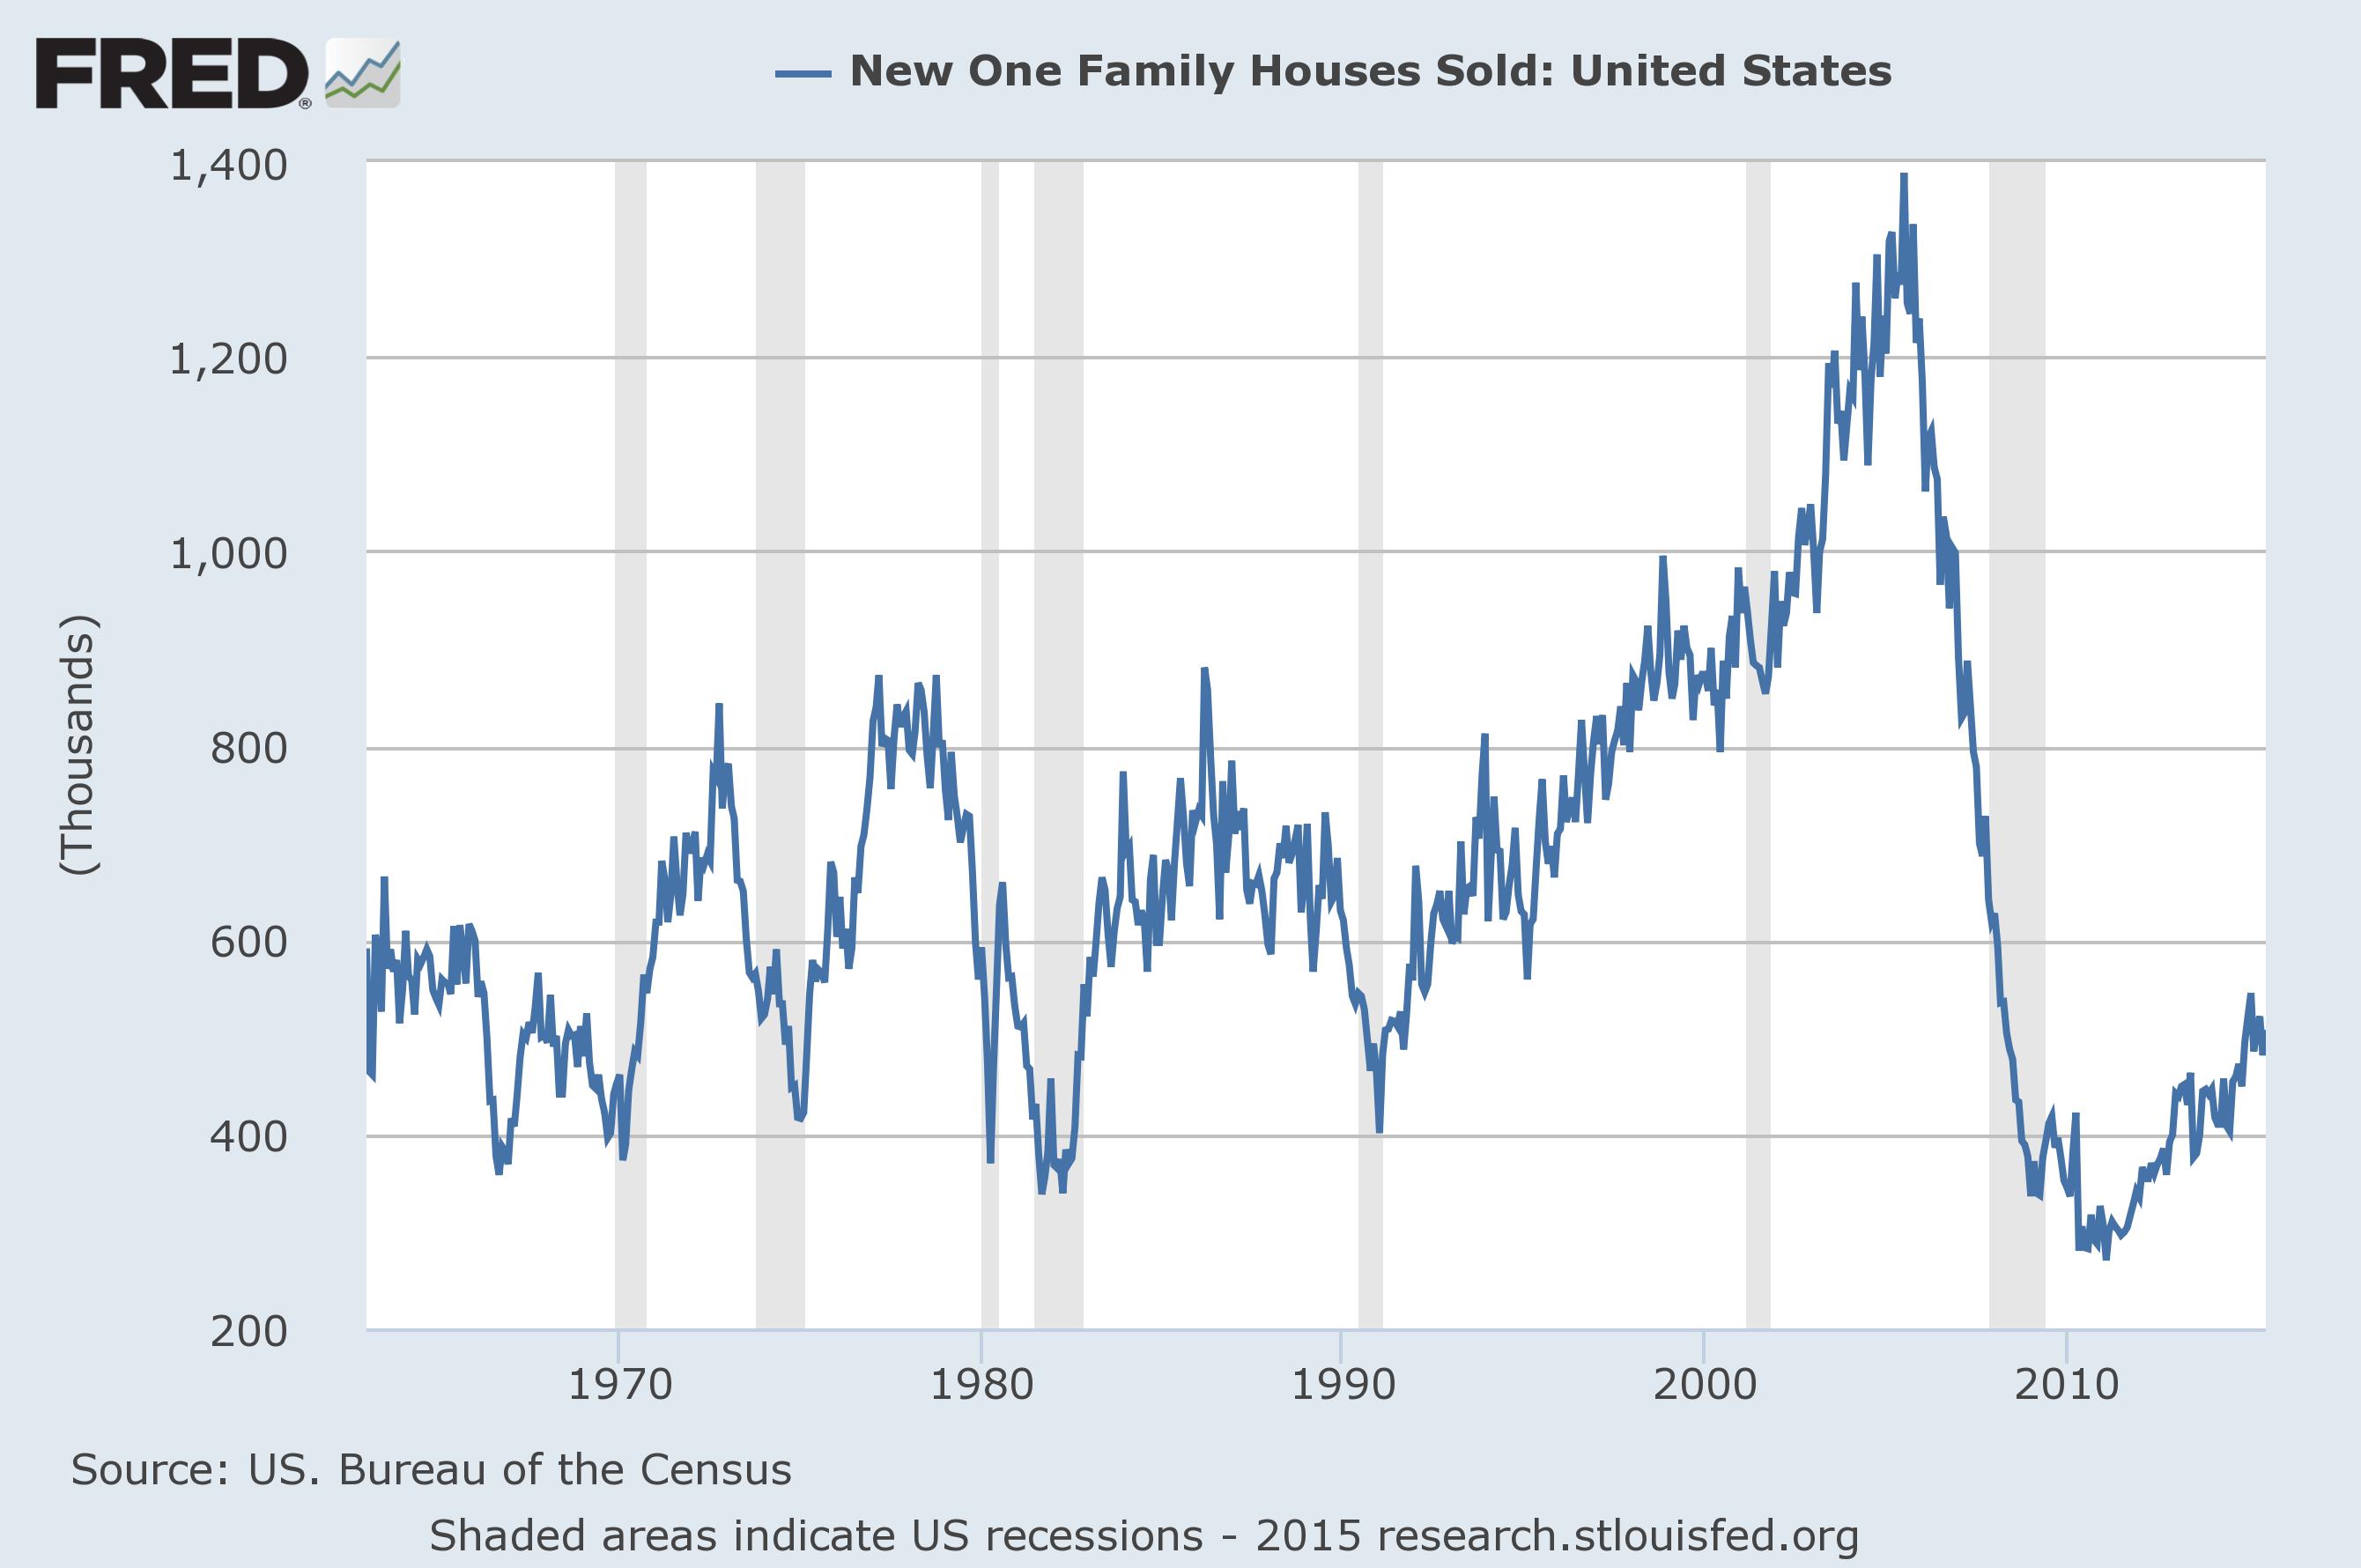
And as the longer chart shows, new home sales are still at very low levels relative to the historical norm:
Conclusion: the news this week was very strong. 2Q15 economic growth rebounded strongly from the first quarter slowdown. Some of that could probably be interpreted as “catch-up” activity; the inclement 1Q weather forced people and businesses to put off purchases until the weather cleared. If we average both quarters, quarterly growth would be ~2%-2.1% which is in line with the standard pace for this expansion. Durable goods may have the same issue. The new home sales numbers were especially important, as they indicate this very important sector continues to expand. However, the cumulative impact of these numbers is an economy that has the strength to survive the China downturn.
Market Analysis
Despite the sell-off, the market continues to be expensive. The current and forward PE for the (NYSE:SPYs) and (NASDAQ:QQQs) are 20.69/22.68 and 17.52/18.90, respectively. And earnings growth is still questionable. From Zacks:
Including this morning’s reports, we now have Q2 results from 491 S&P 500 members that combined account for 98.7% of the index’s total market capitalization. Total earnings for these 491 companies are down -2.4% on -3.6% lower revenues, with 69.7% beating EPS estimates and 49.2% coming ahead of top-line expectations.
We know that Energy has been a big drag on the aggregate growth picture. Excluding the Energy sector, total earnings for the S&P 500 index would be up +5.0% on +1.1% higher revenues. But the growth comparison would still be unfavorable when we look at the results thus far on an ex-Energy basis, as the side by side charts below show.
Even with the energy sector caveats, top line revenue growth is only 1.1%. That means company’s still have to be aggressive with internal policies to increase earnings. There is only so much income statement room companies’ have before needing to increase earnings.
It is difficult to overstate the combined importance of the market’s expensive price and lack of revenue growth. While it’s always possible for the market to rally, stretching the PE to higher and more overbought levels, it’s difficult to see that occurring in the present environment. The SPYs have traded in a very narrow range for most of the year; if they were going to move higher, they probably would have done it by now. And considering the weakness in other averages, (the transports and Russell 2000), the bear argument only becomes stronger.
Despite the weekly rebound, the weekly charts are still negative, starting with the (NYSE:IWMs):
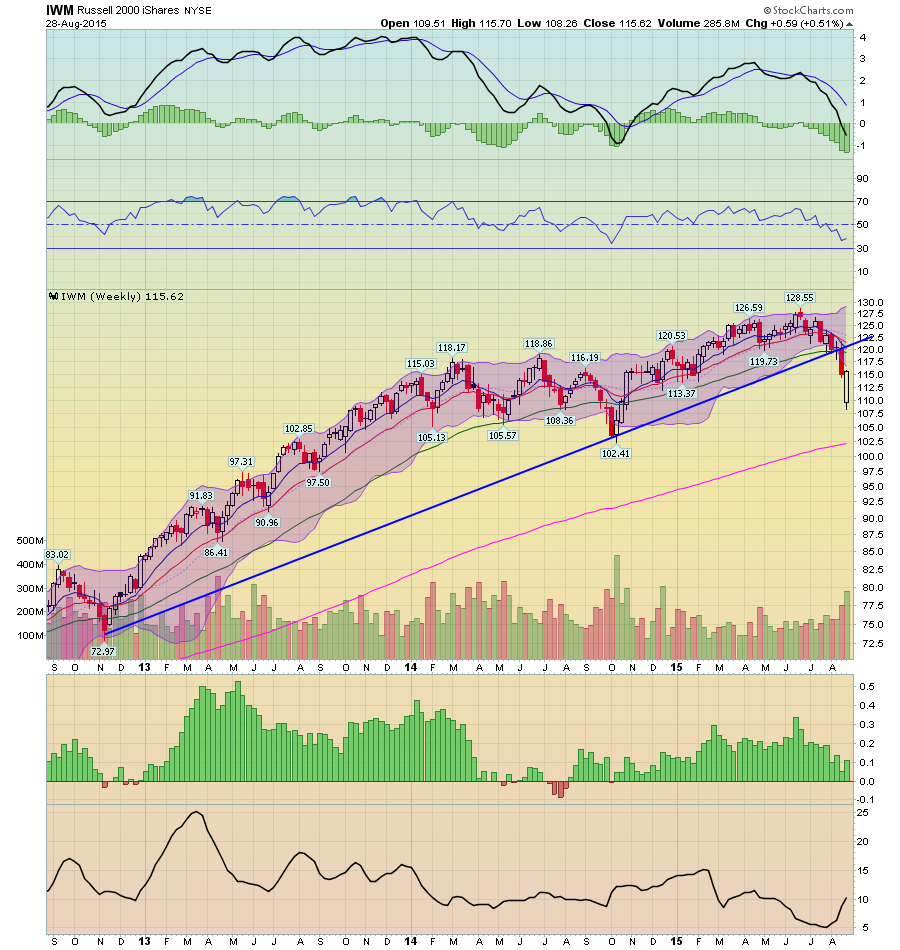
The Russell 2000 is a good proxy for risk capital, as the index’s companies are considered squarely in the “growth” rubric. The weekly chart shows a clear trend break of the 2-year trend started at the end of 2012. And despite the positive candle from last week, prices are still below the shorter EMAs with declining momentum.
The mid-cap indexes as the exact same technical issue:
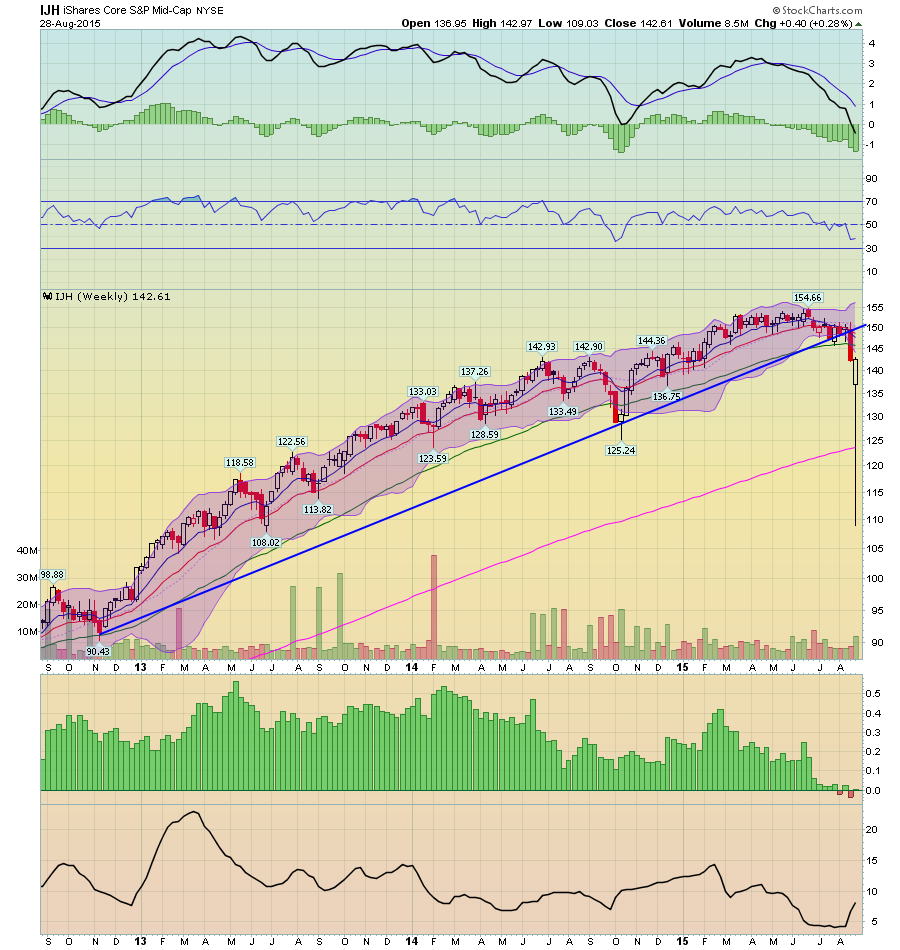
Like the IWMs, the iShares Core S&P Mid-Cap (NYSE:IJH) broke a 2-year trend line over the last week. All the same technical points as the IWMs apply.
And finally, we have the SPYs:
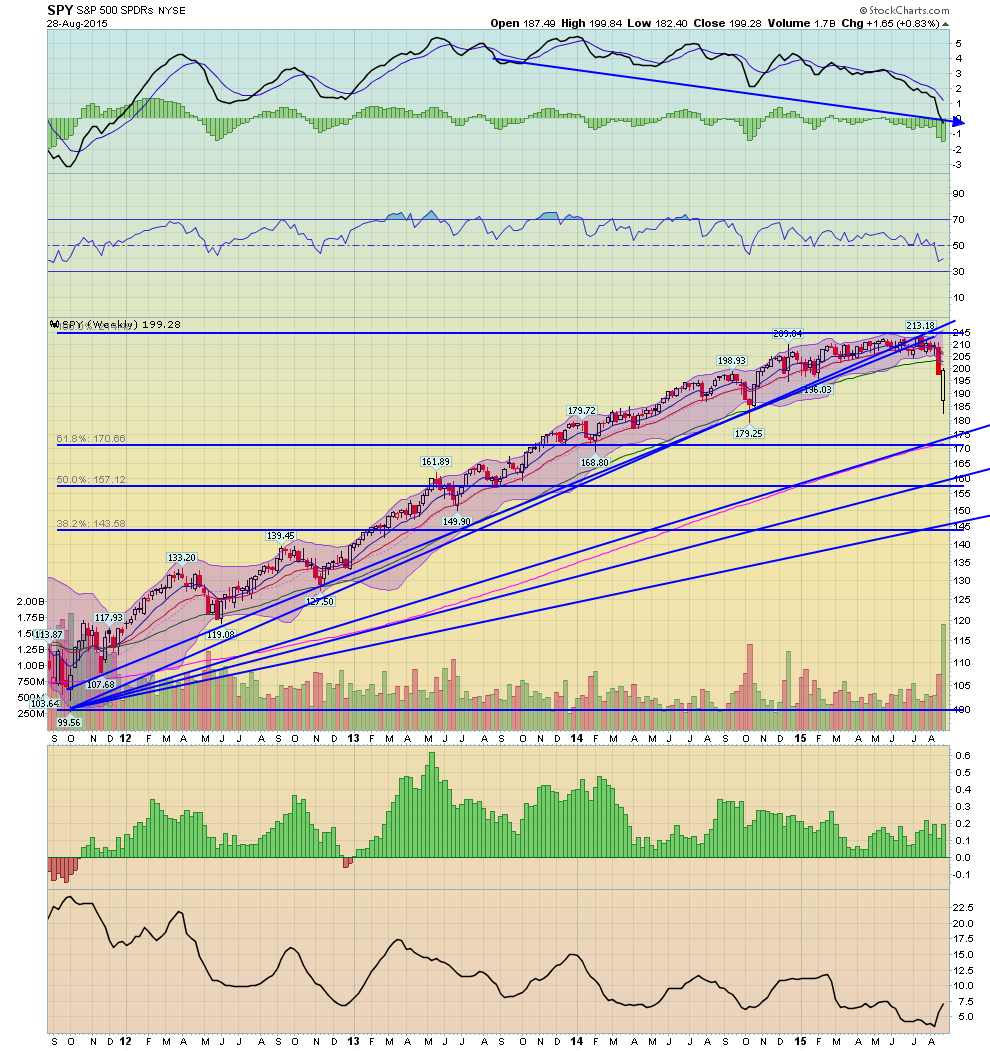
Like the other averages, the weekly chart has broken longer-trend lines. Momentum is lower while prices are below the shorter weekly EMAs. The logical price target is the 200 week EMA, which is also the same level as several Fibonacci retracement levels.
Conclusion: the fundamentals overall are slightly positive because they give companies an environment where they can grow top line revenue. The problem is most companies are just barely doing so. Even excluding the energy sector, top line revenue was only up 1.1% last quarter. Yes, it’s positive, which is obviously better than the alternative. But with market is already pricey; a 1.1% revenue increase doesn’t add a lot of upside room.
