For the last several months, I have expressed three concerns regarding the markets. The high current and forward PEs of the major averages were the first. This was followed by the declining top line revenue of the S&P 500 companies. And third were deteriorating market technicals; a weakening advance/decline line, fewer stocks participating in rallies and various averages (the transports, iShares Micro-Cap (NYSE:IWC) and iShares Russell 2000 (NYSE:IWM)) declining. All of those factors came home to roost this week as the markets sold-off in a fairly sharp manner.
However, foreign, not domestic, events are behind the sell-off. It arguably started in early June when the Chinese markets sold-off sharply. The impetus for the drop was a horribly over-valued market. But fundamental issues also contributed as the Chinese economy has slowed to ~7% annualized GDP growth. Recent statistics point to a continued slowdown.The negative impact of a slowing Chinese economy has rippled to other countries, from those that supply raw materials to Asian trading partners.All have seen a combination of capital flight and depreciating currency. Exacerbating the latter development is the prospective first rate hike from the Fed, which has put a sell order on any emerging market currency. The US equity markets have been caught in a larger wave of a global equity market sell-off.
The US markets are most definitely in a correction now. But it’s just a correction after a long rally.While the US economy isn’t growing at a gangbusters rate, it’s still expanding. And that should be the main takeaway from recent events. Yes, the economy is moving in slow motion. But that’s the very definition of a debt-deflation recovery. And so long as that remains, the correction has a floor.
The Fundamentals
Let’s start with this overarching macro-analysis from the latest Fed Minutes:
The information reviewed for the July 28-29 meeting suggested that real gross domestic product (GDP) rose moderately in the second quarter after edging down in the first quarter, and that labor market conditions continued to improve. Consumer price inflation continued to run below the FOMC's longer-run objective of 2 percent, restrained by earlier declines in energy prices and further decreases in non-energy import prices. Survey measures of longer-term inflation expectations remained stable, while market-based measures of inflation compensation were still low.
There is nothing new in the minutes’ analysis; the economy is grinding forward. PCEs and income are up. Housing is recovering slowly. Industrial production recently rebounded, but that should be seen as an aberration due to the strong dollar and weak overseas economies. The labor market continues healing.The slight upward trajectory of the numbers is confirmed by the coincident economic indicators, released last week:
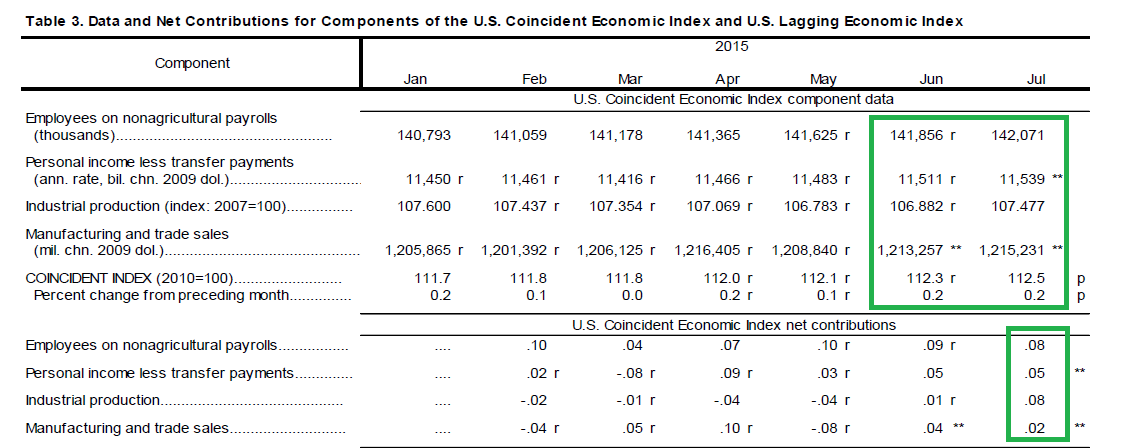
All four components contributed to the .2% rise.
Last week’s leading indicators and building permits saw a distortion thanks to an expiration of a New York tax credit. This pulled permits forward the last few months and led to a sharp contraction this month. Here is a table from the LEI release that highlights the issue:
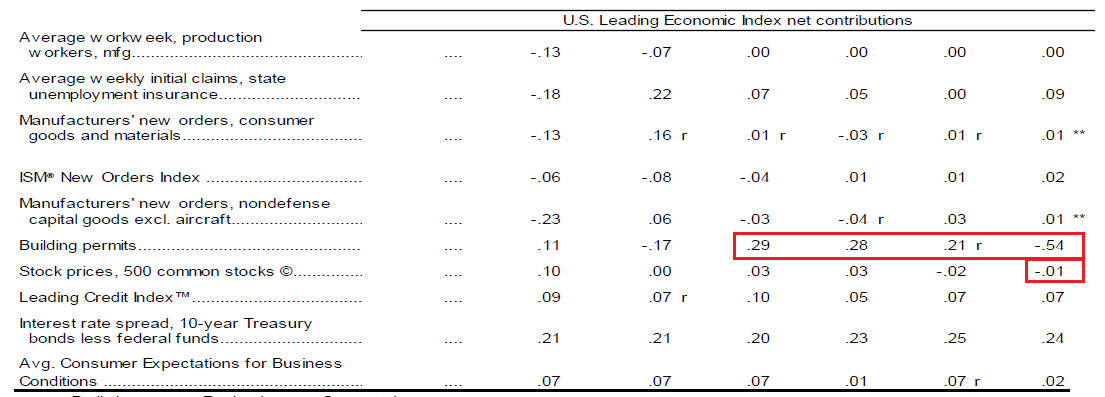
Building permits strongly contributed to the previous three months figures, but subtracted .54 from the current months’ release. Their negative contribution disproportionately impacted the increases of seven other components, greatly skewing the numbers. Smoothing out the last four months of data, we get a gentler impact. Finally, while the rolling six month LEI average is still positive, it is lower than year ago figures, indicating a slowdown in economic momentum.
Other housing sector news was strong.The NAHB housing market index, housing starts and existing home sales are all at or near post-recession highs:
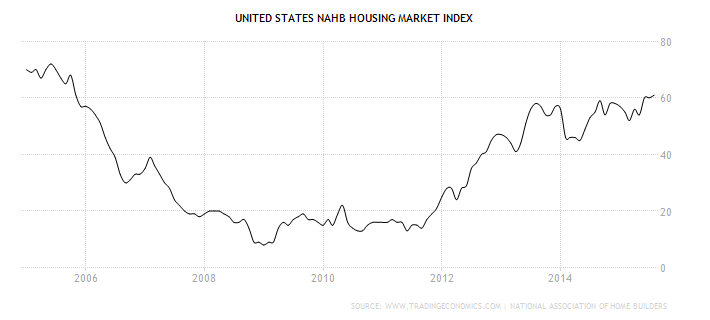
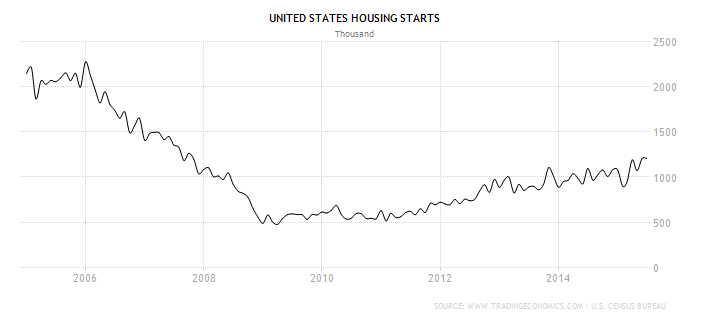
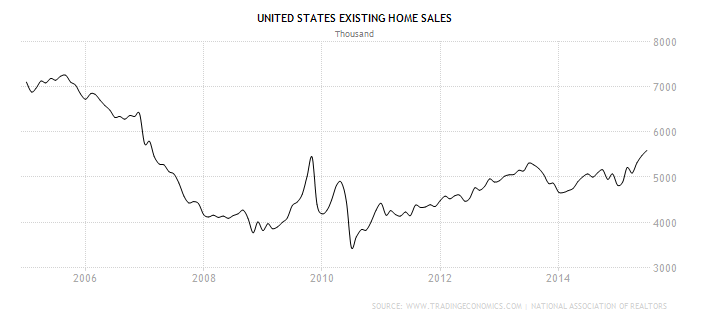
These data points can only be interpreted one way: the housing market is doing well.
Conclusion: After adjusting for the distortions caused by the building permits data, last week’s numbers were good. The housing market continues recovering: homebuilders’ sentiment is high, existing home sales are increasing and housing starts are going strong. Although their six month rate of change is slowing, the leading indicators point to growth. Finally the Fed is correctly assessing an economy that is grinding along.
The Markets
Obviously, sell-off was the big story last week. This did terrific technical damage, sending all the major ETFs through key support on their weekly charts. None were spared. Let’s start by looking at the SPDR S&P 500 (NYSE:SPY):
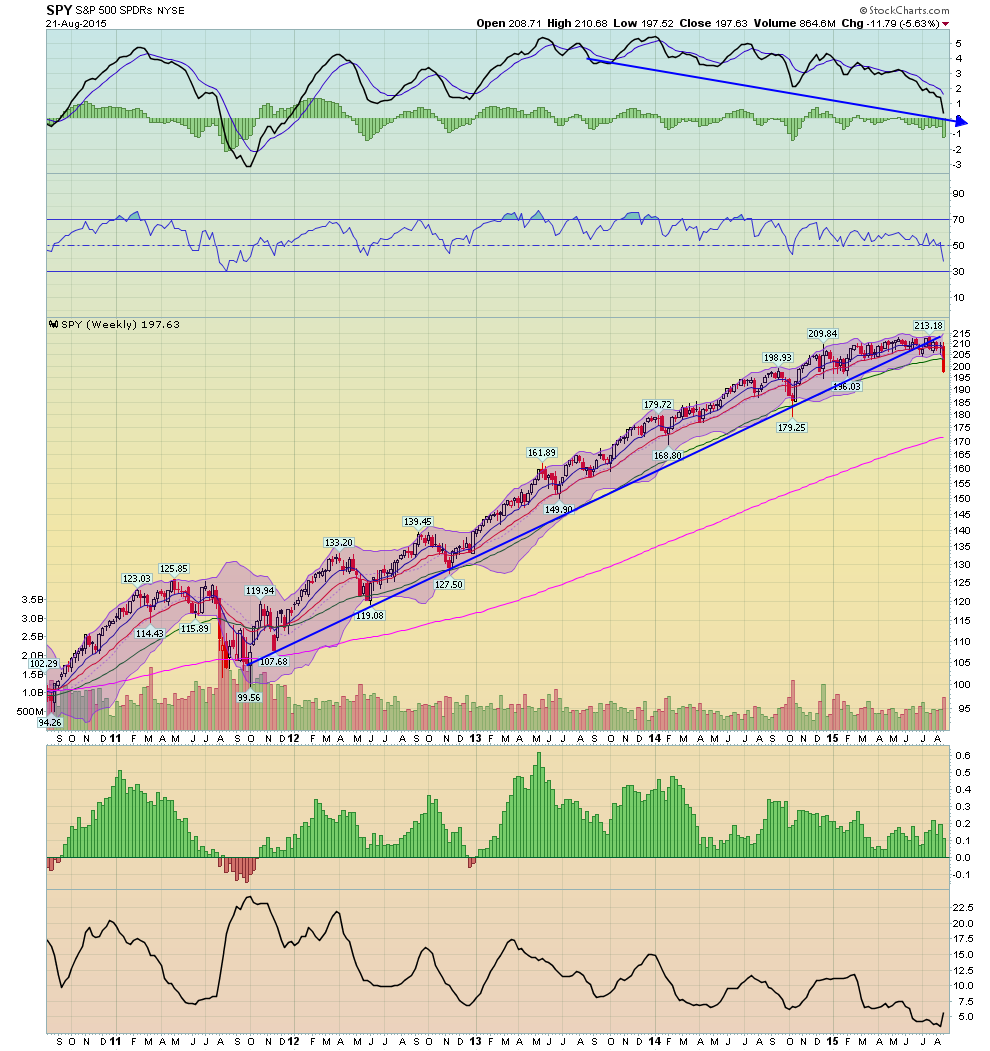
Prices fell through a trend line that connects lows from 2012 and 2014. Momentum is decreasing.
The iShares Core S&P Mid-Cap (NYSE:IJH) – representing mid-caps -- also broke trend.
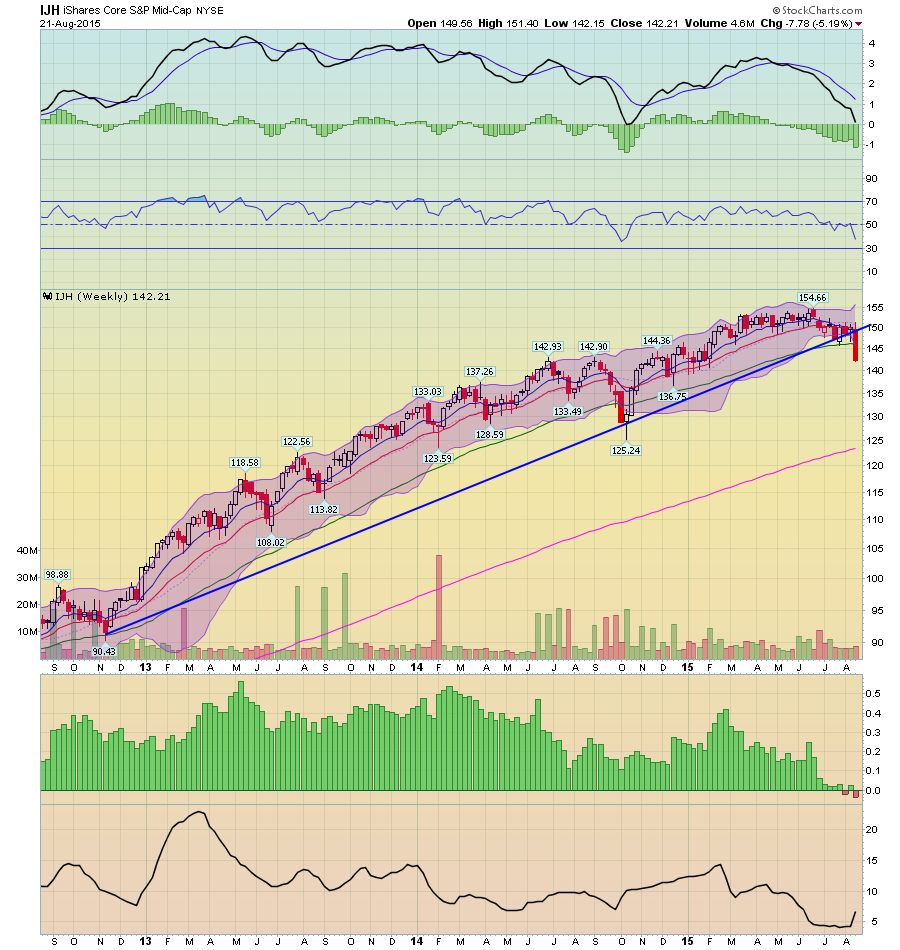
Last week prices fell through a trend line connecting lows from late 2012 and 2014. Like the SPYs, momentum is decreasing.
And finally we have small caps, the iShares Russell 2000 (NYSE:IWM):
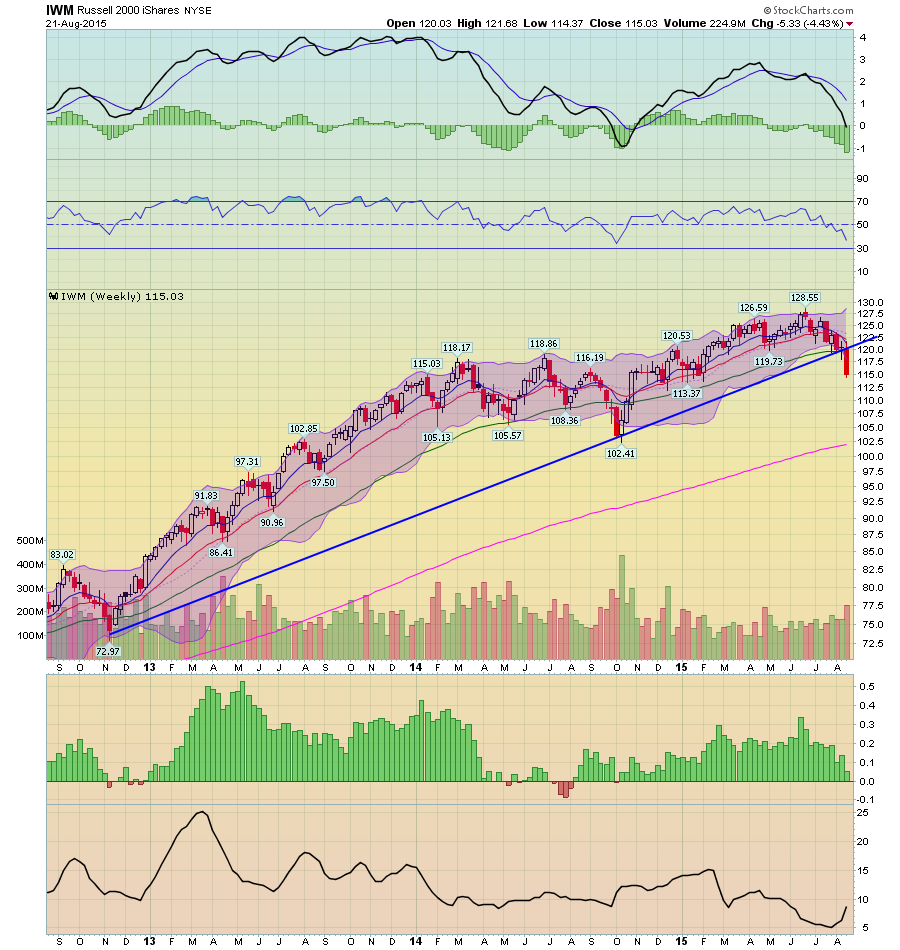
Like the IJHs, prices fell through a trend line connection lows from 2012 and 2014. Momentum is decreasing.
At this point, I want to stress the above charts are weekly, making the trend breaks that much more important. We’re no longer talking about minor fluctuations that in the long-run are meaningless. Instead, last week’s price moves represent fundamental changes to the trading narrative.
Let’s tie these events into the macro backdrop, because nothing happens in a vacuum. China is the problem; its growth is slowing and that is sending economic ripples out across the globe. This hurts the US in two ways; 1.) It lowers international growth of large US multi-national corporations (which lowers earnings leading to lower equity prices), and 2.) It increases the dollar’s value, which contributes to point 1 and hurts exports (read, weakens US industrial production). But, the US continues growing, albeit slowly. US consumers are spending, and to a lesser extent, businesses are investing. The best news remains the housing recovery. Builder’s sentiment is high, people are buying houses and, best of all, builders are building. It’s difficult to overstate this sector’s importance to the macro economy. And there are sufficient economic sub-components contributing to growth to keep growth positive.
The key -- as pointed out by my co-blogger – is interest rates. And there we have a mixed picture. The treasury market is cooperating:
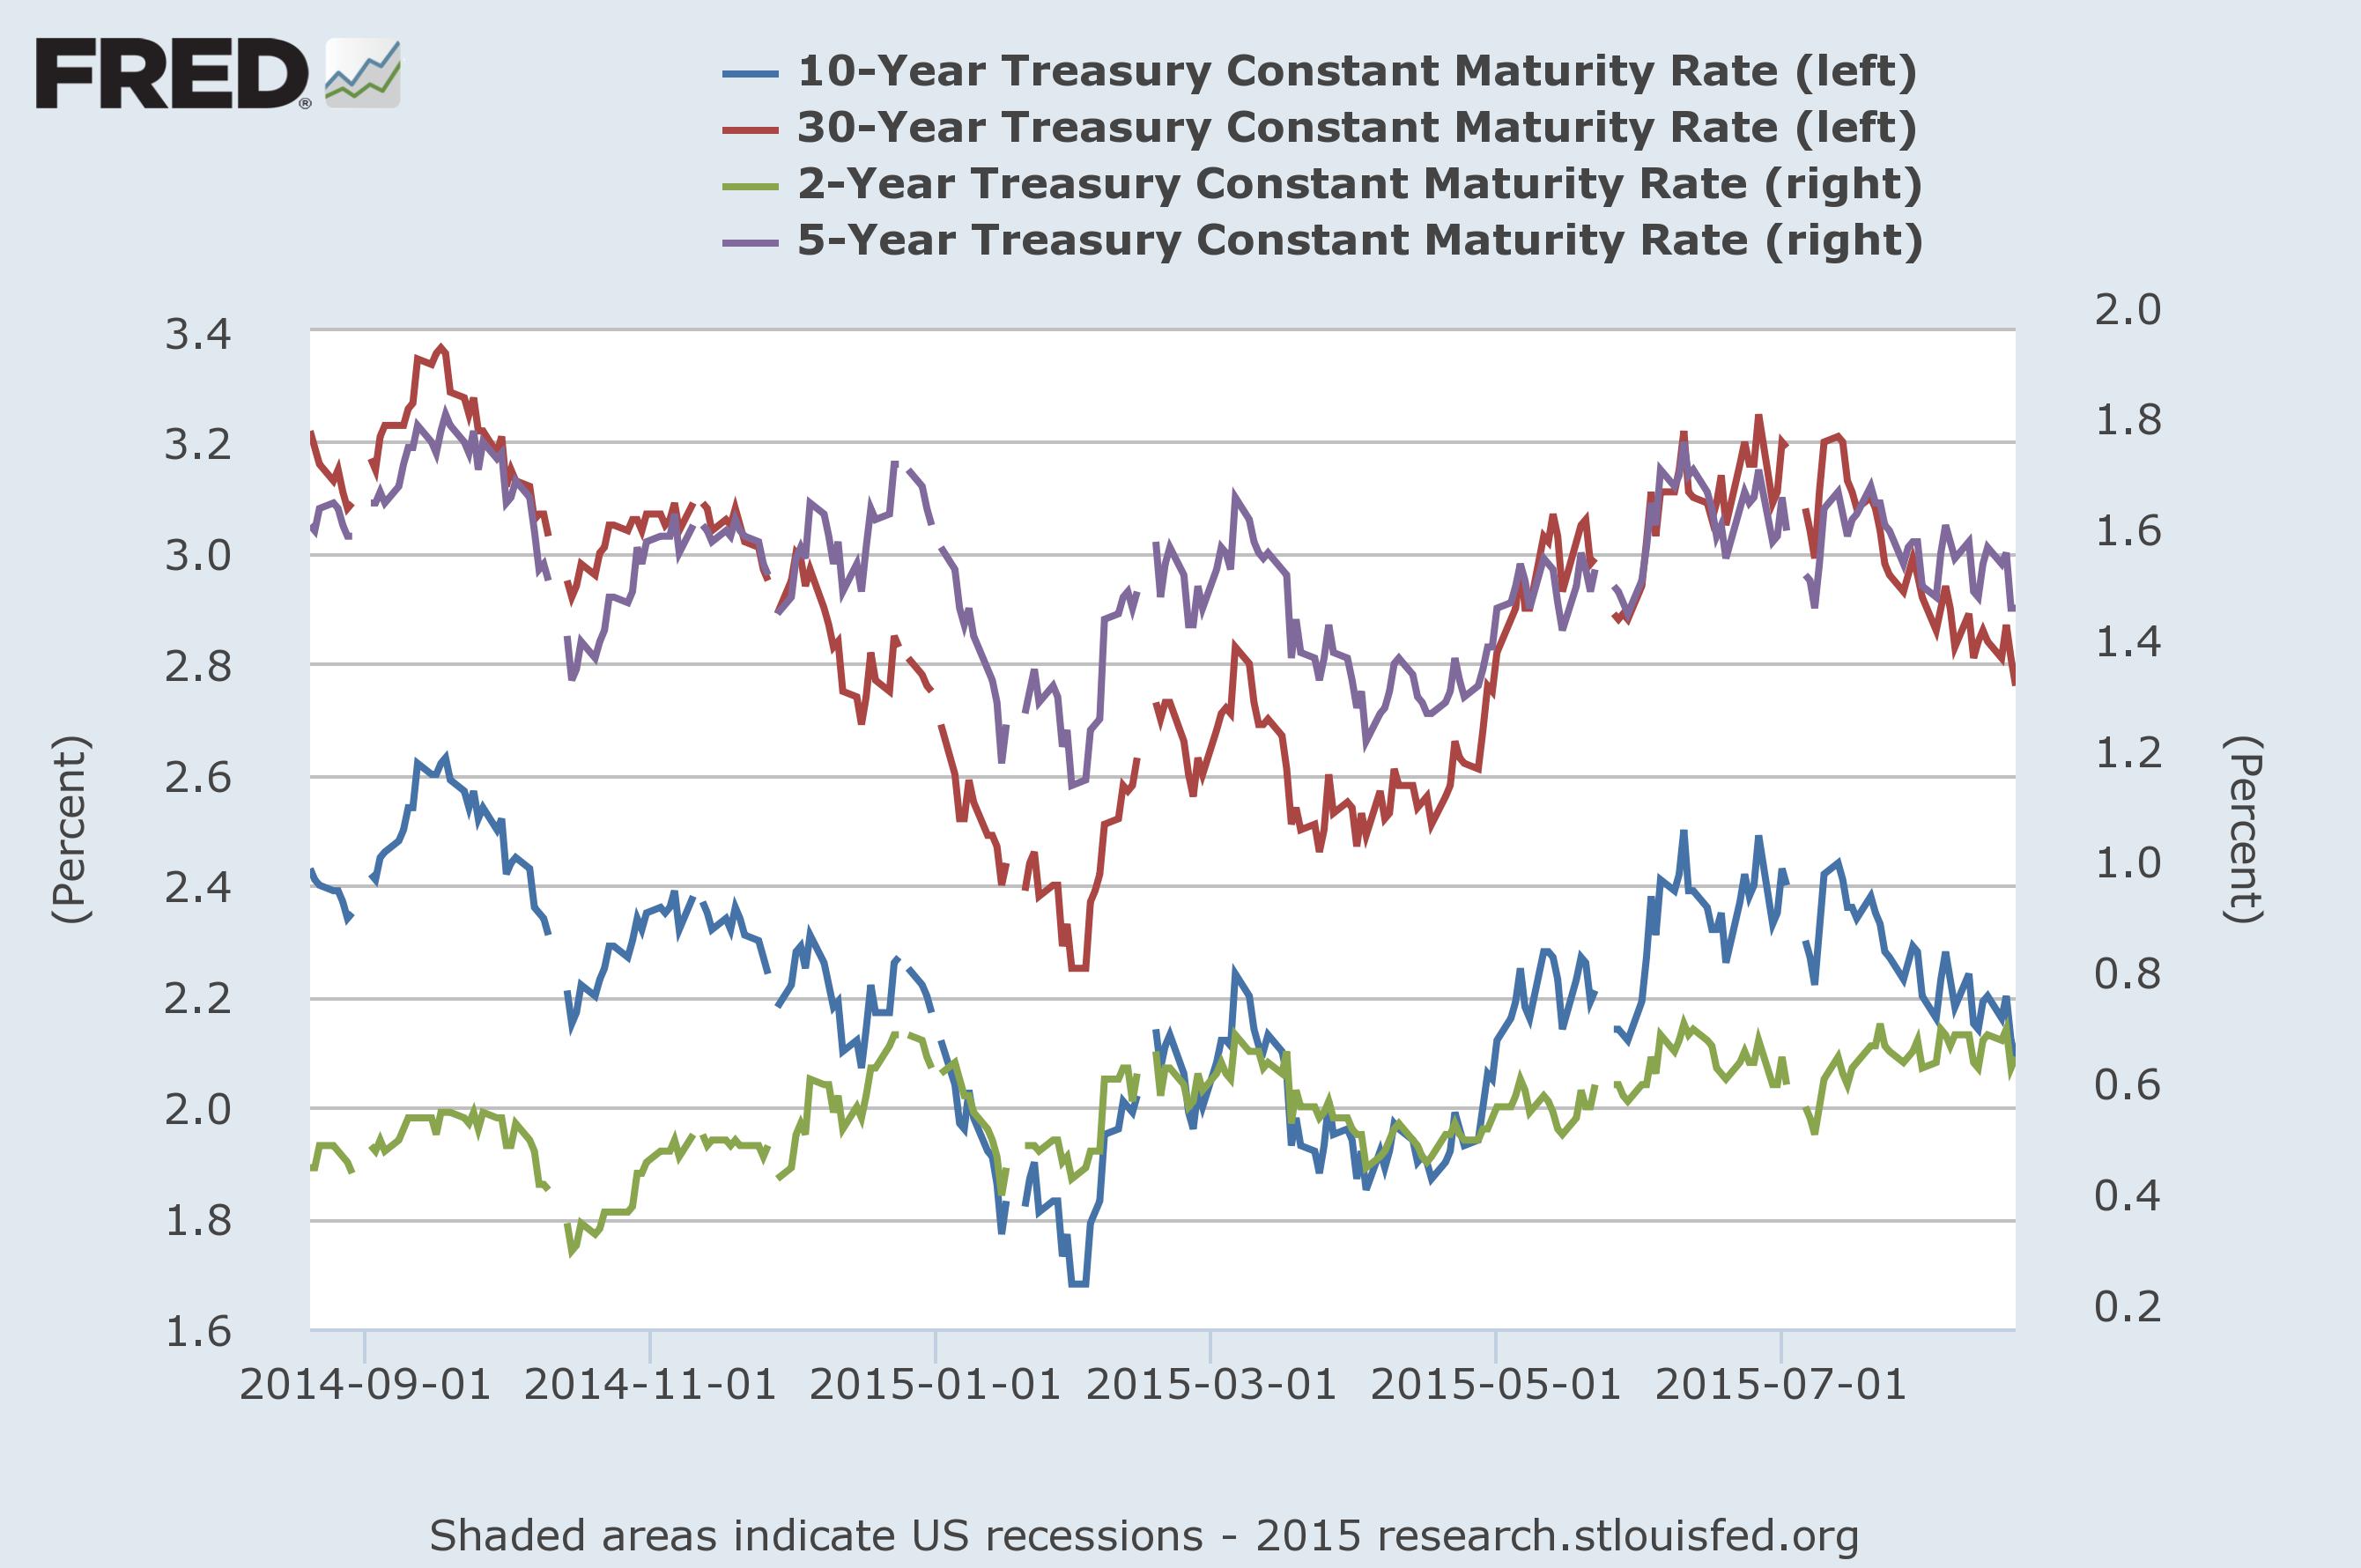
Longer yields have come in since July 1. The 30-Year (red line, left scale) has dropped ~40 basis points while the 10-Year (blue line, left scale) is down about 20 basis points. Even the 5-Year is helping, dropping ~30 basis points. But the corporate market has seen deterioration:
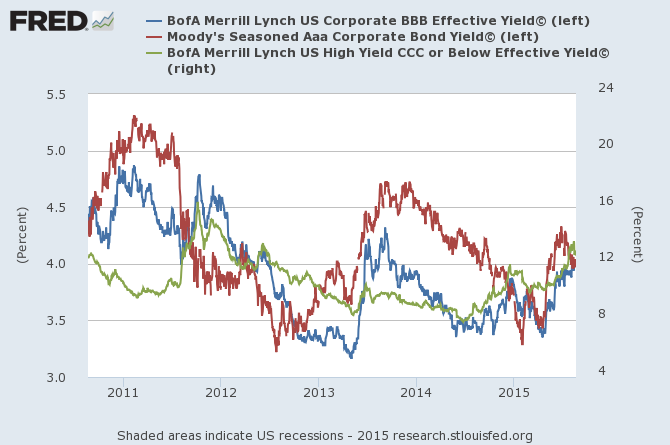
CCC credit (green line, right scale) has widened since mid-2014, rising ~500 basis points (~8% to 13%). We can attribute some of this to the oil’s price drop. But not all, as BBB credit has (blue line, left scale) widened 50 basis points this year (~3.5%-4%). AAA however, has come in about 25 basis points in the last few months, catching a safety bid. Thankfully, the Chinese slowdown has put a bid safety under US treasuries, which will help keep rates low.
Where does this end up? I have no idea. The charts will tell us when we get there. But, we are most definitely in a correction now.
