The S&P 500 closed farther from the early June highs than the day before. The bull is telling us it wants to run, now that it's becoming apparent that the bears are out of breath since their mid-July tech ambush.
The month end is approaching, and so is the window of opportunity to extend the $600 weekly addition to unemployment benefits, and pass the new stimulus into law before the August recess. While continuing unemployment claims under regular state programs are declining, couple that with special pandemic ones, and they're still clinging to their highs.
But as strange as it might sound, the stock market hasn't been about the struggles of the real economy these weeks. All eyes are on the stimulus and vaccine hopes (whatever one imagines under the latter term), not on the corona-case panic and hyped death charts.
Time for another quick reality check.

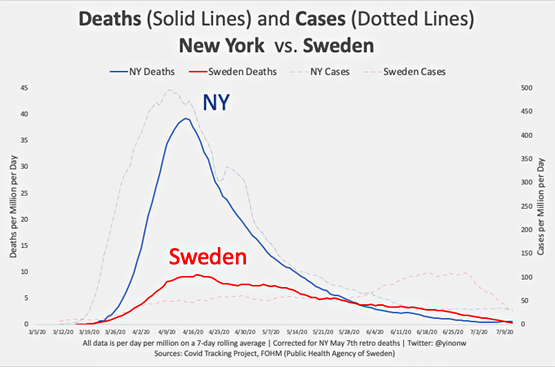
Have you seen this comparison between New York and no-lockdown Sweden (courtesy of Lew Rockwell and David Stockman)? The markets see through that, and keep their focus on the countermeasures instead. Money printing is in our future, and won't really end until inflation rears its ugly head.
S&P 500 in the Short-Run
I’ll start with the daily chart perspective (charts courtesy of http://stockcharts.com ):

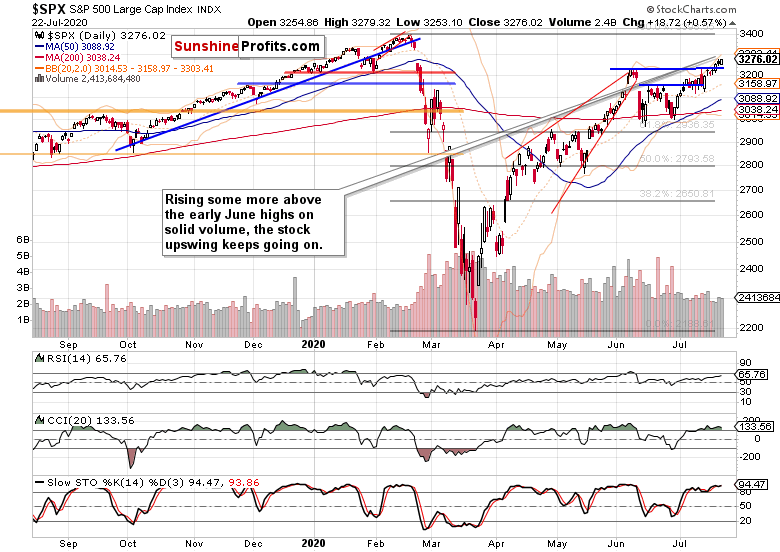
The upper blue line marking the early June highs is getting more distant day-by-day. Volume is picking up, and the price action doesn't exactly show the bulls as relenting. Prices keep cutting into the late-Feb bearish gap without real opposition from the sellers.
Let's check the credit market clues next.
The Credit Markets’ Point of View
High yield corporate bonds (HYG ETF) again rose yesterday, but not without attempting to decline. The volume though shows the bears weren't really serious about it. Still, the bond ETF paused at its early June highs, and while I wouldn't focus on those highs as a meaningful resistance strong enough to make S&P 500 crash and burn, it can exert a limited and temporary influence.
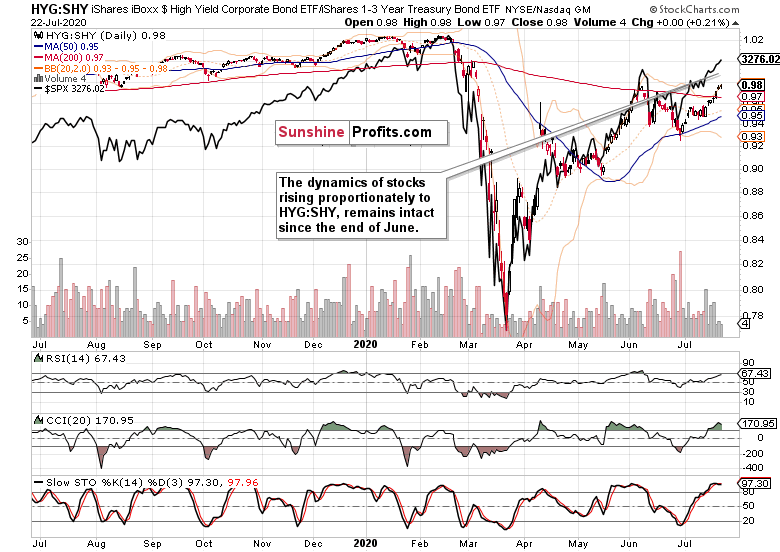
Better to look for more comprehensive clues such as the leading credit market ratios—and both the high yield corporate bonds to short-term Treasuries (HYG:SHY) and investment grade corporate bonds to longer-dated Treasuries (LQD:IEI), are rising together.

On a daily basis, the HYG:SHY ratio wavered a little, but stocks marched higher as vigorously as in previous days. A short-term noise that needn't have repercussions—the key point is that both are broadly continuing higher.
That's the message of the stocks to Treasuries chart too. The relative valuation of both asset classes continues favoring stocks. Yes, Treasuries remain in a secular bull market and calls for its end earlier this decade have proven premature, but it's stocks (that is companies) that are rising faster here—as they always do when we're in "everyone benefits, no one pays" stage of inflation.
By the way, did you know that inflation used to be about tracking the monetary base increases, and not the symptom of rising real-world prices? Talk of putting the cart before the horse—the latter is a secondary effect of a greater money pool chasing the same amount of goods and services.
Smallcaps, Emerging Markets And The S&P 500 Internals
The Russell 2000 (IWM ETF) took to yesterday's S&P 500 cue. Rising, but the drawn-out underperformance goes on. Little wonder given that smallcaps are more connected to the real economy than the 500-strong index.
While I expect the S&P 500 to challenge and overcome its February highs this year, the Russell 2000 has a tougher ride ahead in doing so. The emerging markets chart shows these markets having started to outperform already, which the smallcaps clearly haven't.
While emerging markets (EEM ETF) have declined yesterday, that isn't a sign of a trend change. It calls for short-term caution as the US index is a little exposed here.

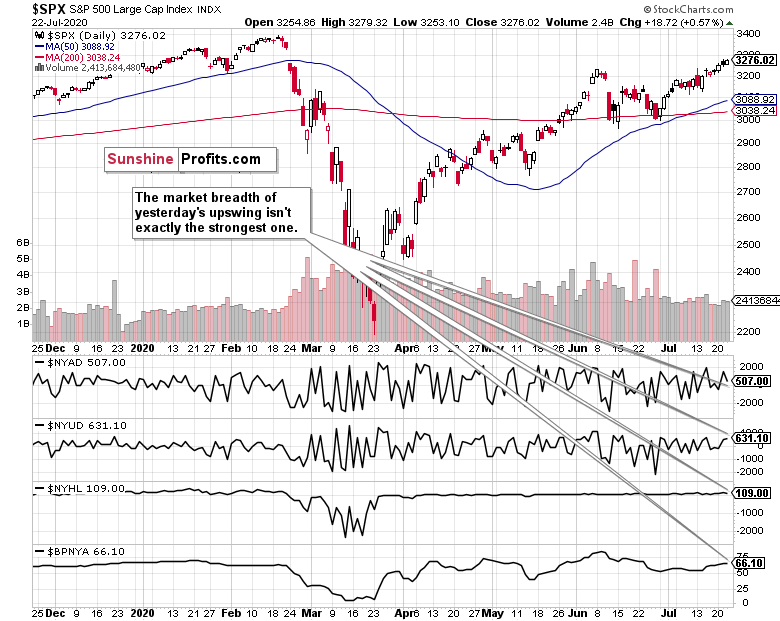
The market breadth view confirms that. To see advance-decline line retreating on a stock advance, is never a short-term sign of strength. The rising bullish percent index, though, points in the direction of dips being better bought, as we're firmly in a stock bull market territory.
Volatility is also in favor of caution. As it challenges the early June lows, the upper knots are telltale signs of it striving to move higher next. And little wonder, as the real world outlook didn't get brighter, or calmer over the recent weeks. The coming stimulus will buy us some time, and encouragingly, the Fed is no longer in a week-to-week tightening mode. Obviously though, stocks are banking on more.
Summary
Summing up, the health of the S&P 500 upswing yesterday leaves quite a bit to be desired, and highlights a solid likelihood of upcoming weakness in stocks. Nothing extraordinary in its outlook-changing power though. The stock bull is alive and well, thriving on sensible rotation. What I look for is a temporary setback that would bring down the rising greed, so as to capitalize on short-term mispricing opportunities (or disappearing cautionary signs) within the stock bull run.
