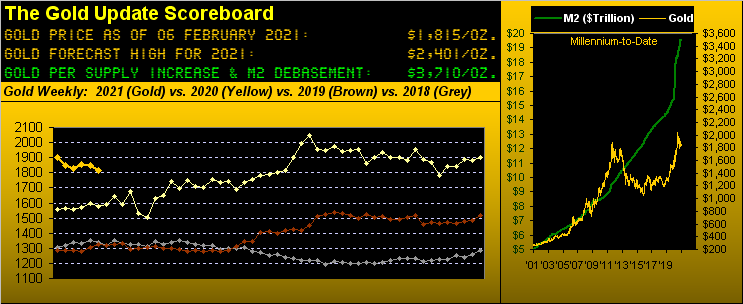
Gold historically has (rarely) been broadly categorized as "overbought" vis-à-vis currency debasement, our arguing such case in price "having gotten ahead of itself" back in 2010-2011 as graphically depicted in the above millennium-to-date panel. Otherwise its being disregarded and disrespected occurs when 'tis treated as a commodity, especially whilst the sinister stock market is fawned over as being, well, "Gold." Such seems the current state of these two mighty markets.
In last week's missive we used the phrase "This drives us bats" in citing FinMedia enthusiasm over stock market earnings beating estimates instead of beating prior period results as is the case for just 60% of S&P 500 constituents thus far in Q4 Earnings Season. Now, the same phrase applies to Gold's being booted about as a commodity rather than being revered (not just as a currency but) as THE Currency. One wonders for how much longer the blind eye to both non-supportive earnings and Dollar debasement can be maintained. For from our perspective, the Great Halving of the S&P and Doubling of the Gold price is hurtling toward us like a freight train. (Yet given that few seem to hear it, perhaps 'tis a silent, green e-train...)
Further, in musing over writing a book on it all going wrong, we sense 'tis so close to so doing, 'twould occur in the midst of penning the tome. Were such circumstance morphed into one of those disaster films, the star would exclaim: "There's not enough time to warn the sheeple!" Dollar bills in people's pockets would start spontaneously combusting with the financial planet then bursting to bits, even as some FinTV knucklehead shrieks "It's a buy! It's a buy!" Don't laugh: 'tis coming to a theatre near you.
That said, Gold really is off to a lousy start for the year, whilst the S&P 500 garners yet another all-time high (3887), +3.5% in 2021. As we saw a week ago in our BEGOS Market Standings, Gold remains the worst of the bunch, now -4.5% in settling yesterday (Friday) at 1815. Even with the air coming out of the "Silver Squeeze", she's still +1.9% on the year. And at the sharp end is Oil +17.9%, clearly no surprise given Executive direction to curtail StateSide energy supplies.
In fact, so maligned was the price of Gold this past week, that in trading down to 1785 'twas just six li'l ole points from eclipsing the 1779 level that would've flipped ("Don't say it!") the weekly parabolic trend from Long to Short. Fortunately, Friday's bargain hunters fought their way up through the market's offers to allow Gold to live Long at least through week's end. Here are the weekly bars with said parabolic trends from one year ago-to-date:
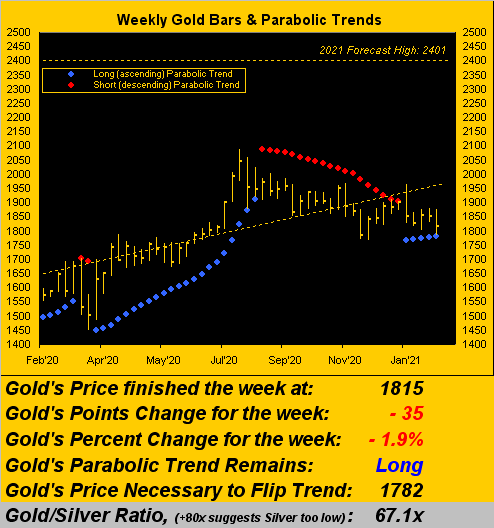
But this Long parabolic trend is now well within range of being Short-lived (thank you "Pun Dept.") given that the distance from the present 1815 price to the flip price (1782) is just 33 points: Gold's expected daily trading range is now 30 points, let alone the expected weekly trading range being 72 points. So now is the time to come to Gold's fold, lest it really get sold as nothing more than a commodity in costume mode.
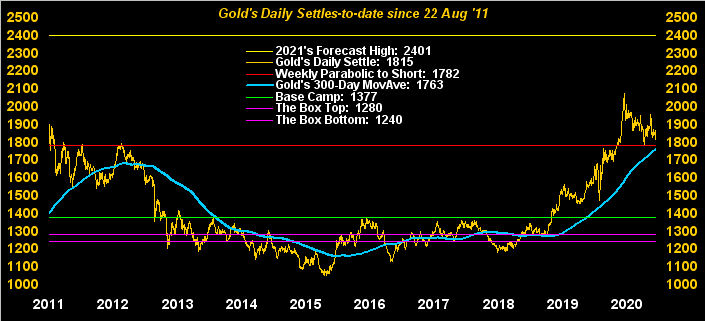
Still from a broad technical perspective, higher Gold can start to unfold. Follows is our long running chart of Gold's daily closes from some ten years ago-to-date, the wavy blue line therein being the once stalwart 300-day moving average. Recall during Gold's bull phase of this century's first decade, the 300-day moving average was a precision supporter of price. Then through the first half of the second decade, the average was a reliable repeller of price. But more recently, these last two years again find the average supportive: and given 'tis now up to 1763, the notion is that any further Gold downside from here shall be limited to that average's rising level. So don't find yourself in the "If Only I'd Bought..." crowd. To reiterate, our forecast Gold high for this year is 2401 per the top line in the graphic:
As to the StateSide economy and the nation's new Executive having already signed some 48 "actions", you know what they say: "The more the control, the greater the dole." 'Course, that hasn't yet worked into the Economic Barometer's metrics: such transition ought begin having some early effect once we get into March (as February data gets reported). Still, in what we've been tongue-in-cheek referring to as "The Biden Effect", the Baro put in another relatively good week as the ADP Employment reading whirled 'round from -123,000 in December to +174,000 for January. Whirling 'round as well was the Bureau of Labor Statistics payrolls number, their Unemployment Rate improving from 6.7% to 6.3%. And with the balance of the bunch, the Baro again bounced:
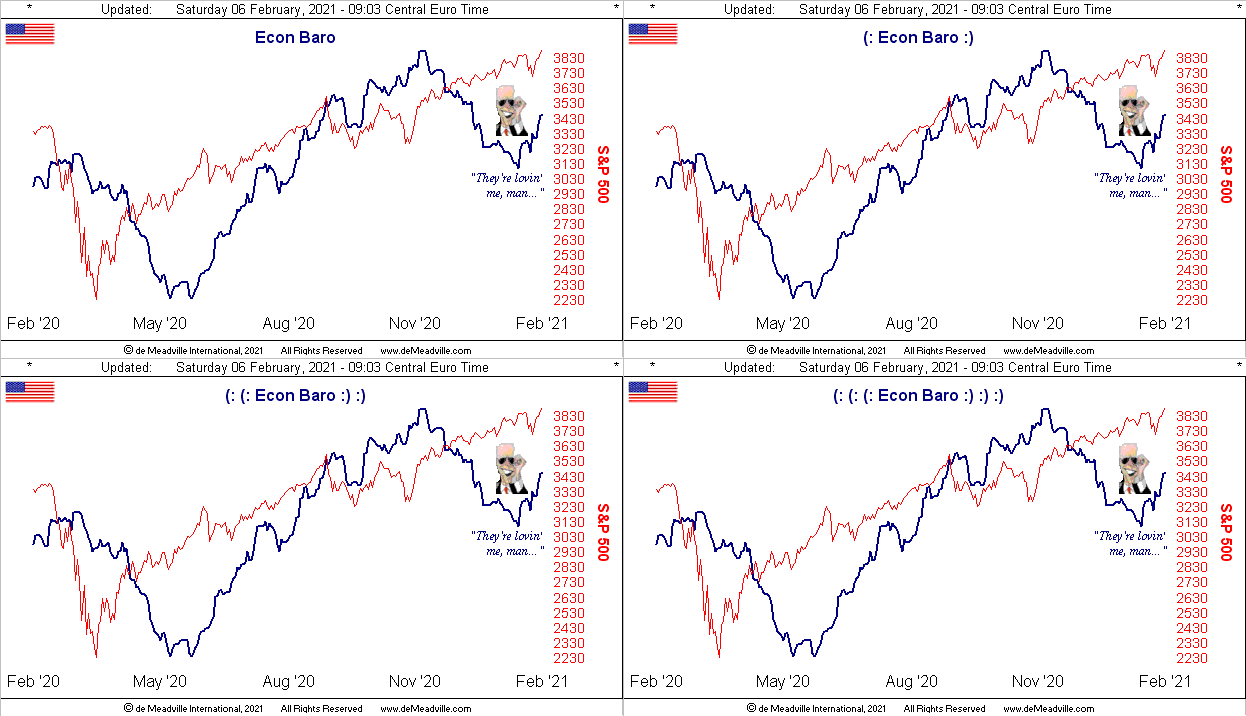
Regardless, we're not sure the Congressional Budget Office is tracking the Econ Baro, their projecting this past week for the U.S. economy to reach the "pre-pandemic peak" by the middle of this year. 'Course by the above Baro, 'twas already well-achieved this past November but incoming data then became more problematic as shutdowns were extended. (Remember way back in March when just a two-week worldwide shutdown was expected to have rid COVID? "If for two weeks it can't spread, it'll be dead" ... so they said).
"Control is an intoxicant, mmb..."
So some say, Squire, until it comes back to bite one's own butt. Still, Minneapolis' Neel "Best Name for a FedPres" Kashkari sees the StateSide economy far and away from full recovery. And whilst Asian metrics are improving, the EuroZone's economy is being dubbed as "desperate" given COVID continues to rampage amid the comparably slow roll-out of vaccines.
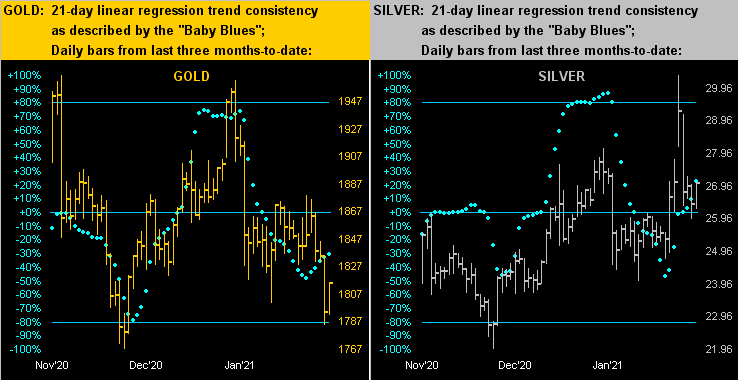
Meanwhile, rolling downward has been our Gold although hardly so has Silver. Here we've the two-panel graphic across the last three months of daily bars for the yellow metal on the left and for the white metal on the right. Clearly the latter's failed "squeeze play" is evident, but the better news is the pricing of Silver vis-à-vis Gold, the G/S ratio today at 67.1x, well in-line with the millennium-to-date average of 66.2x. Again in that vein: a Gold high this year of 2401 thus means Silver 34.30:
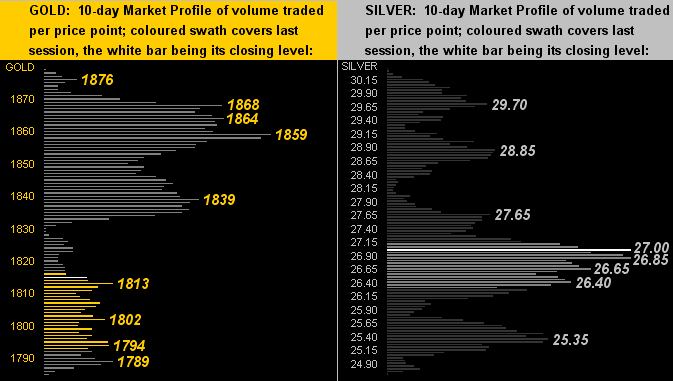
So standing to reason is Gold's 10-day Market Profile depicting price as having been weaker than that of Silver. No Gamestop gaming of our Gold there. Indeed for Gold (below left), its trading resistance thicket runs from the 1830s well up into the 1860s. Yet for Silver (below right), after being squeezed then unseized, she finished Friday essentially on her most heavily traded price of the past fortnight per the white volume line at 27:
Therefore, our bottom line finds Gold at present being treated more as in commodity costume than as true currency...
...oh that is rather raggedly pathetic. So sorry, Helvetia! Hang on a sec... ("Squire, will you please get on to the Graphics Dept?") In the meantime, put in a good word for your own financial well-being and grab some real Gold! (Good gracious, really...)
Cheers!