Last week saw a lot of assets and indicators go up yet again.
This is a theme that the market will likely continue to grapple with for the next several weeks or months because we are in the midst of a battle between three very influential “ups”.
1. Earnings
2. Inflation
3. Asset prices
There seems to be widespread agreement that these are all rising, and in the near-term, will continue to rise.
Another uncontested relevant market moving trend that is going up is the number of consumers and workers reentering the economy.
However, HOW the economy reopening will impact all of these ups is, in many trader’s opinions, up for debate.
As you’ll read in this week’s market highlights below, there are several developments that suggest we should look out for some changes in what we should expect to continue to go up.
Some will say this is bad. At MarketGauge, we’ll treat it as an opportunity.
After a year like no other, with restaurants closed, office buildings empty, amusement parks and theaters shut down, and few people driving to work as the “pandemic” caused most services and goods to be shuttered. Gas prices fell, hotels and airline flights were ridiculously inexpensive, and businesses suffered.
Now the economy is reopening. Consumers are traveling and spending money at businesses that were previously restrained or closed.
Economists will explain that this increased demand and consumption will lead to increased prices (inflation) and higher company earnings.
In fact, as noted above, higher inflation with higher earnings is happening.
Additionally, the Federal Reserve says they want to “heat up” the economy and welcome inflation exceeding 2-3%.
So far, this is bullish. The markets react with higher equity prices reflecting higher earnings.
The Elephant In The Room
However, the elephant in the room is that equity markets also fear inflation in the same way that when camping in the woods, it’s nice to have a campfire, but nobody wants a forest fire!
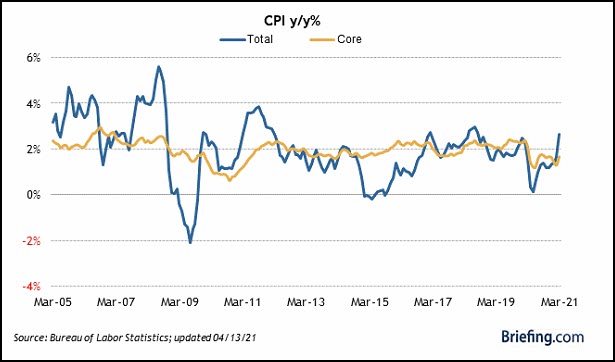
Last week the monthly Consumer Price Index (CPI) numbers were reported, and the data was “as expected.”
As you can see by the chart below, the data doesn’t appear to be anything abnormal which is typically what equity investors like to see.

However, if you’ve been a reader of this newsletter, and/or a reader of our partner and Head of Trading Research and Education, Michele “Mish” Schneider, then you know this chart does not show the picture that the market may soon be focused on.
For over a year, Mish has been warning in her free commentary, live media appearance, premium trading services and more, that bad inflation is coming, and it’s already showing up in the food and raw materials.
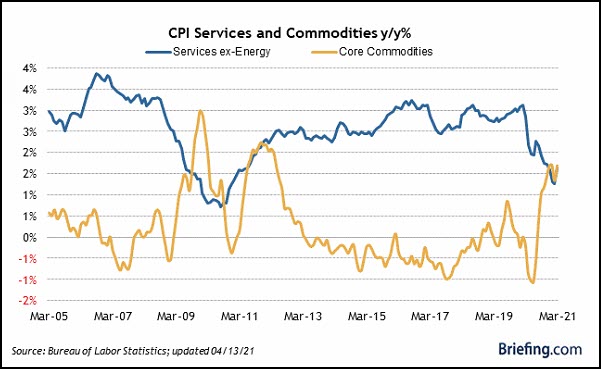
Here’s another view of last week’s CPI data from the perspective of commodity inflation.

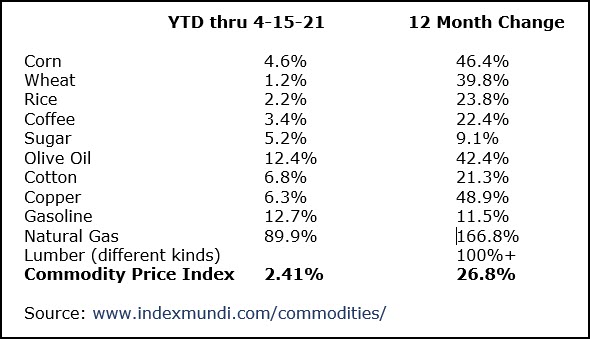
To put some more clarity into what the big move up in the chart of commodity prices looks like in the real world, here’s a sampling of how prices of commodities have moved…

Campfire or Forest Fire?
Clearly, commodity prices are running way above the Fed’s target of 2–3%.
What will happen if the reopening of the economy leads to the services sector inflation to reverse course and significantly inflate?
What will happen as higher commodity prices work their way into the costs of goods and companies need to raise product prices?
Like a forest fire, inflation has a reputation for being difficult to contain when it accelerates too quickly and it ignores Newton’s familiar quote…
"What goes up must come down."
This is what the bond and equity markets fear and gold bugs hope for.
As of right now, the bond market (TLT) has indicated some concern by selling off this year, but equity markets appear unphased.
However, there have been (and will continue to be) trading opportunities that stem from this rise of inflation long before the headline numbers and the Fed recognize it as a “problem.”
For example, Mish and our models have been trading stocks and ETFs of the asset classes that will go up due to inflation.
We’ll also continue to keep you abreast of the messages that the markets send about how fearful they are of this developing trend.
Here are this week’s market action highlights:
- The SPY Risk Gauge slipped to neutral down from bullish last week. This could become significant if we experience a pullback, but that hasn’t started.
- SPY, QQQ, and DIA all extended their 3-week melt-up patterns at all-time highs, while IWM remained in a consolidation pattern at its 50-day moving average (DMA).
- Gold (GLD) broke out of a 6-week range and over its 50 DMA. It has had a notable bullish leading divergence pattern in our Real Motion (10/50) indicator for the last several weeks, which suggests this move could be real.
- Gold miners (GDX) continued their 50 DMA breakout pattern and broke out of a 6-week range.
- Utilities (XLU) broke of a range on a closing basis that it has been in since October 2020. It closed at its highest level since its all-time highs in Feb. 2020. This sector has lagged the market this year but recently has been rallying in lockstep with the recent rally in the long bonds (TLT).
- Long bonds (TLT) broke out of 4-week range and stopped at its 50-DMA. Its recent low and consolidation sit on its 200-week moving average.
- Homebuilders (XHB) continued their melt-up move higher, which is now 25% higher than its March 2021 low and over 300% higher than its March 2020 low.
- Commodities had big moves higher (again). Lumber (WOOD) rallied over 3% and has now risen over 8% in April alone. Crude Oil (USO) broke out of a 4-week range sitting on the 50 DMA. Agricultural commodities (DBA) closed at its highest level since December 2018, and it made a new swing high after a retracement to its 200-week moving average breakout. Copper (JJC) or (@HG) broke out of 6-week range.
- Semiconductors (SMH) was the only sector in our Sector Summary table to be down on the week. This is the second week of under-performance and an inability to reach new highs. This is notable as it was a leader in turning up from the market correction.
- Coinbase (COIN), became the first publicly traded cryptocurrency exchange and has a market capitalization of $63 billion which is more than double that of the NASDAQ Exchange at $26 billion.
- The Dollar (UUP) is sitting on its 50-DMA, after pulling back from failing to break over its 200 DMA several weeks ago.
- Despite better than expected earnings reports from the major banks, the XLF only had modest gains for the week. This could be an indication that the market has priced in very high expectations for earnings season.
- Health Care (XLV) was one of the top 3 performers this week, up 3.0%, with Utilities (XLU) up 3.7% and Materials (XLB) up 3.7%. This is significant considering the fact that last week’s “best performers,” XLU and XLV, are the worst-performing sectors on a YTD, 3-month, and 6-month basis. Additionally, these two sectors are often used as defensive places to be invested.
- High-Yield debt (HYG) underperformed relative to TLT, which reflects some risk-off sentiment.
This Week's Market Highlights
The TLT bounced off its 200-week moving average a few weeks ago, and this move higher has continued. This stabilization of the decline in TLT (the rise in rates) prompted the equity market correction to reverse course, and...
This latest rally in equities began with strength in SMH and large-cap tech.
It’s notable that while QQQ and SPY have hit new highs, SMH has stalled well below its prior highs.
Additionally, there are other signs of some risk-off rotation, such as the move up in XLU, XLV, and a lack of strength in IWM and HYG.
Further risk-off action and potentially an acknowledgment of the increase in commodities inflation was demonstrated by GLD and GDX, which both had very strong moves higher.
Mish was right on top of this move in her latest appearance on Fox Business News which you can see here.
As you'll learn in that short interview Fox Business host Charles Payne closed by saying...
“I love you Michele, you’re going for Gold when everyone else is running away”
Plus... If you'd like a more detailed explanation of why Mish made such a bold market call on gold...
In conclusion...
There doesn’t appear to be any obvious price patterns in SPY, QQQ or DIA to suggest an imminent selloff in this asset class.
However...
Unlike inflation, stocks have a reputation for reversing their up trends quickly.
Enjoy the uptrend, but also keep your risk management tactics up too!
