One important dynamic of portfolio construction and risk management is understanding how your stocks fluctuate in relation to the broader market. This factor is often referred to as “beta,” which is essentially the historical volatility of a stock or fund in relation to a benchmark such as the S&P 500 Index.
The higher the measured beta of your holdings, the greater price fluctuations they will have in comparison to the benchmark. A high beta score doesn’t necessarily mean that your investments will outperform on the upside or underperform on the downside. It simply means they have exhibited characteristics of outsized moves or over-reactions in the past.
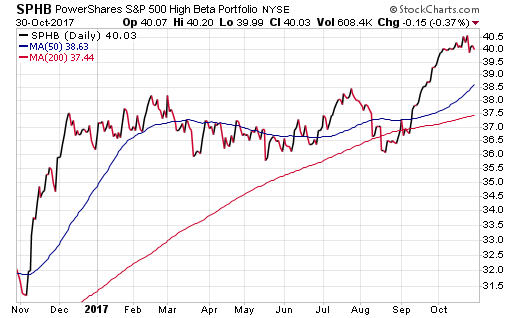
An exchange-traded fund that tries to capture this phenomenon is the Powershares S&P 500 High Beta Portfolio (NYSE:SPHB). This ETF identifies 100 stocks from within the broader S&P 500 Index with the highest historical sensitivity to price moves over the preceding twelve months. To achieve that goal, it continually reconstitutes and rebalances the basket of holdings on a quarterly basis to ensure the underlying portfolio is meeting its expected factor dynamics.

Each holding within SPHB is given an equal weighted portion of the portfolio at the rebalancing marker. This allows every company to provide a relatively similar contribution to the overall performance of the fund.
One of the more common attributes shared among stocks in the high beta index is their smaller size. SPHB is filled with companies from the bottom quartile of the market-cap weighted S&P 500 Index. This includes stocks such as Under Armour Inc (NYSE:UAA), Chesapeake Energy (NYSE:CHK), and Navient Corp (NASDAQ:NAVI). Furthermore, there isn’t a single stock from the top 10 largest holdings in the SPDR S&P 500 ETF (NYSE:SPY) represented in the high beta portfolio.
To underscore this point, the weighted average market cap of SPHB is $27.5 billion compared to the mean market cap of SPY at $47.38 billion. It’s well understood that smaller stocks tend to be more volatile overall and the portfolio construction data backs up that thesis.
It’s also worth analyzing the other end of the spectrum in thePowershares S&P 500 Low Volatility Portfolio (NYSE:SPLV) as well. This fund is trying to accomplish the exact opposite of SPHB. Its goal is to seek out 100 stocks from within the S&P 500 Index with the lowest historical price fluctuations compared to the broader market. SPLV has a weighted average market cap of $87.5 billion and contains several mega-cap stocks such as Microsoft Corp (NASDAQ:MSFT) and Johnson & Johnson (NYSE:JNJ).
From a performance standpoint, the data becomes predictably mixed, as is the case with many smart beta strategies. SPHB has outgained SPY on a one and five-year lookback, while falling short on a three-year scale through 9/30/17. This often happens as conditions in the market fluctuate and impact the more concentrated basket of holdings compared to the broader index.
While SPHB is one of the few funds that focuses strictly on stocks with high beta characteristics, it’s certainly not the only option to consider in this arena. It’s logical to conclude that small and midcap indexes with potentially higher volatility are suitable candidates for this genre.
For example, the iShares Russell 2000 Value (NYSE:IWN) boasts a beta to the S&P 500 Index of 1.86 as of the most recent quarter-end. The Guggenheim Invest S&P 500 Pure Value (NYSE:RPV) calculates its most recent beta at 1.35 to the market as well. These are just two examples from a wide pool of small cap multi-sector ETFs demonstrating high beta characteristics.
The Bottom Line
Sector selection and other fundamental criteria can play an important role in the overall volatility of an all-stock portfolio. However, as the saying goes, size matters. Smaller stocks tend to exhibit characteristics of enhanced price swings that make them better suited for a high beta portfolio.
The views and opinions expressed herein are the views and opinions of the author and do not necessarily reflect those of Nasdaq, Inc.
Disclosure : FMD Capital Management, its executives, and/or its clients June hold positions in the ETFs, mutual funds or any investment asset mentioned in this article. The commentary does not constitute individualized investment advice. The opinions offered herein are not personalized recommendations to buy, sell or hold securities.
