Gold bulls are back in control as prices of the precious metal have soared around 11% since late May to reach their highest level since September 2013.
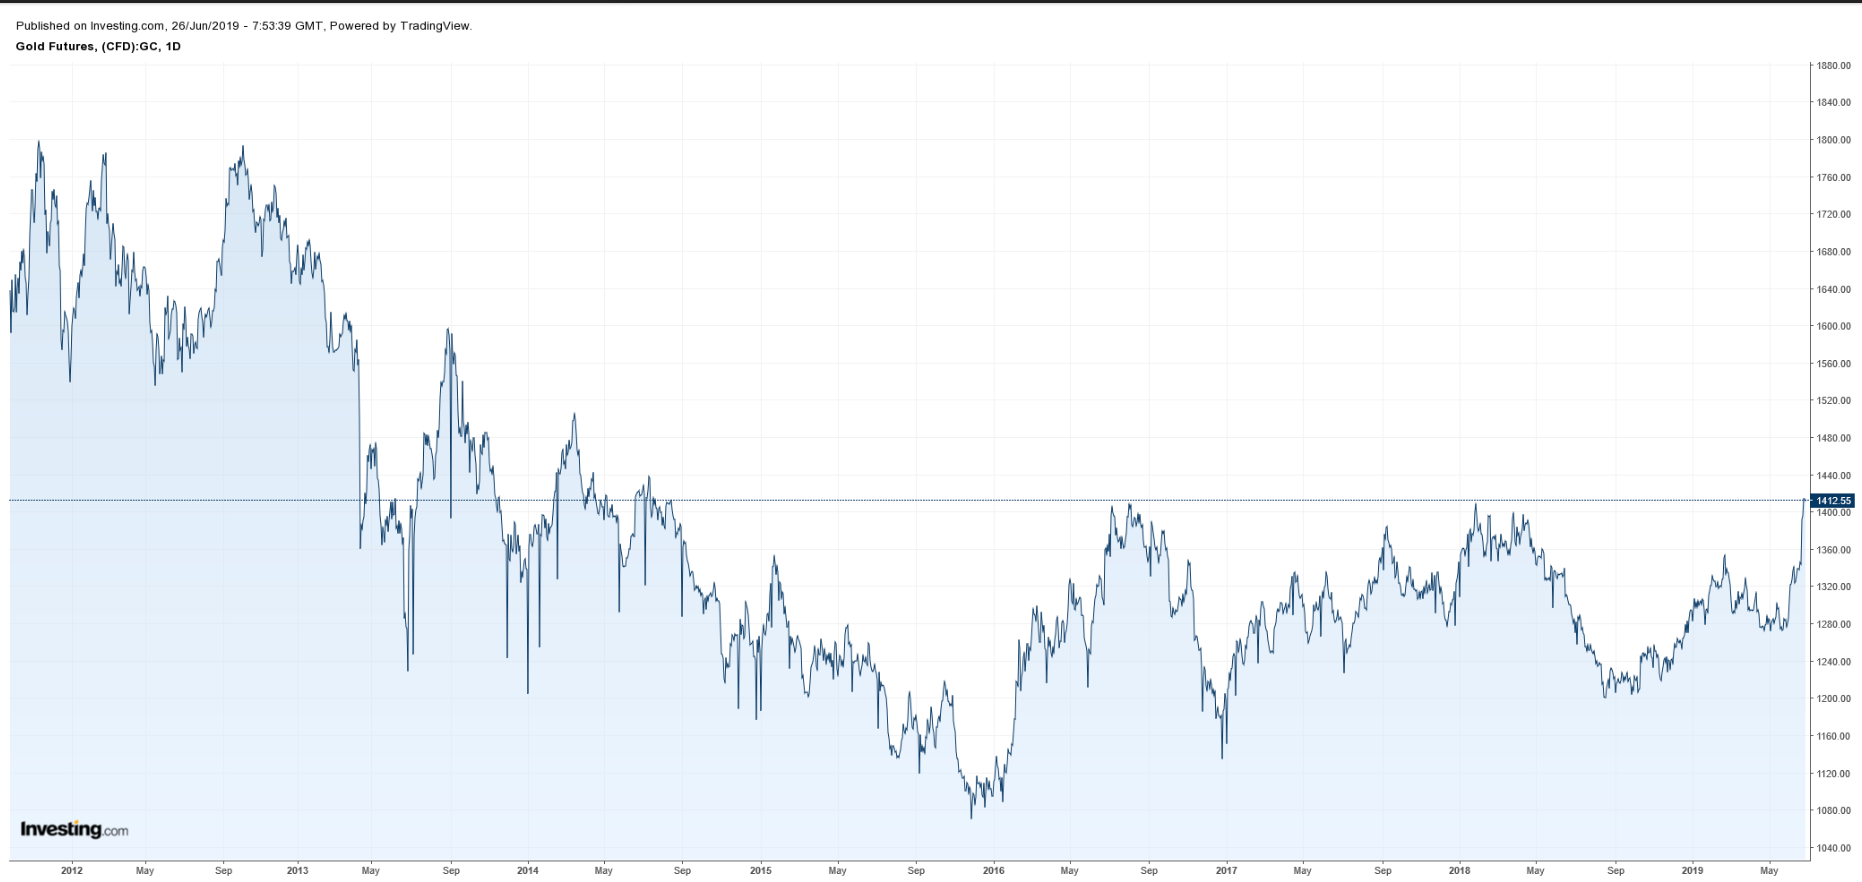
Gold fever has escalated on improved prospects for easier monetary policy from the Federal Reserve, with markets currently pricing in a 100% probability of a rate cut in July. Mounting geopolitical tensions between the U.S. and Iran and lingering uncertainties on the U.S.-China trade front have also attracted investors to the safe haven asset.
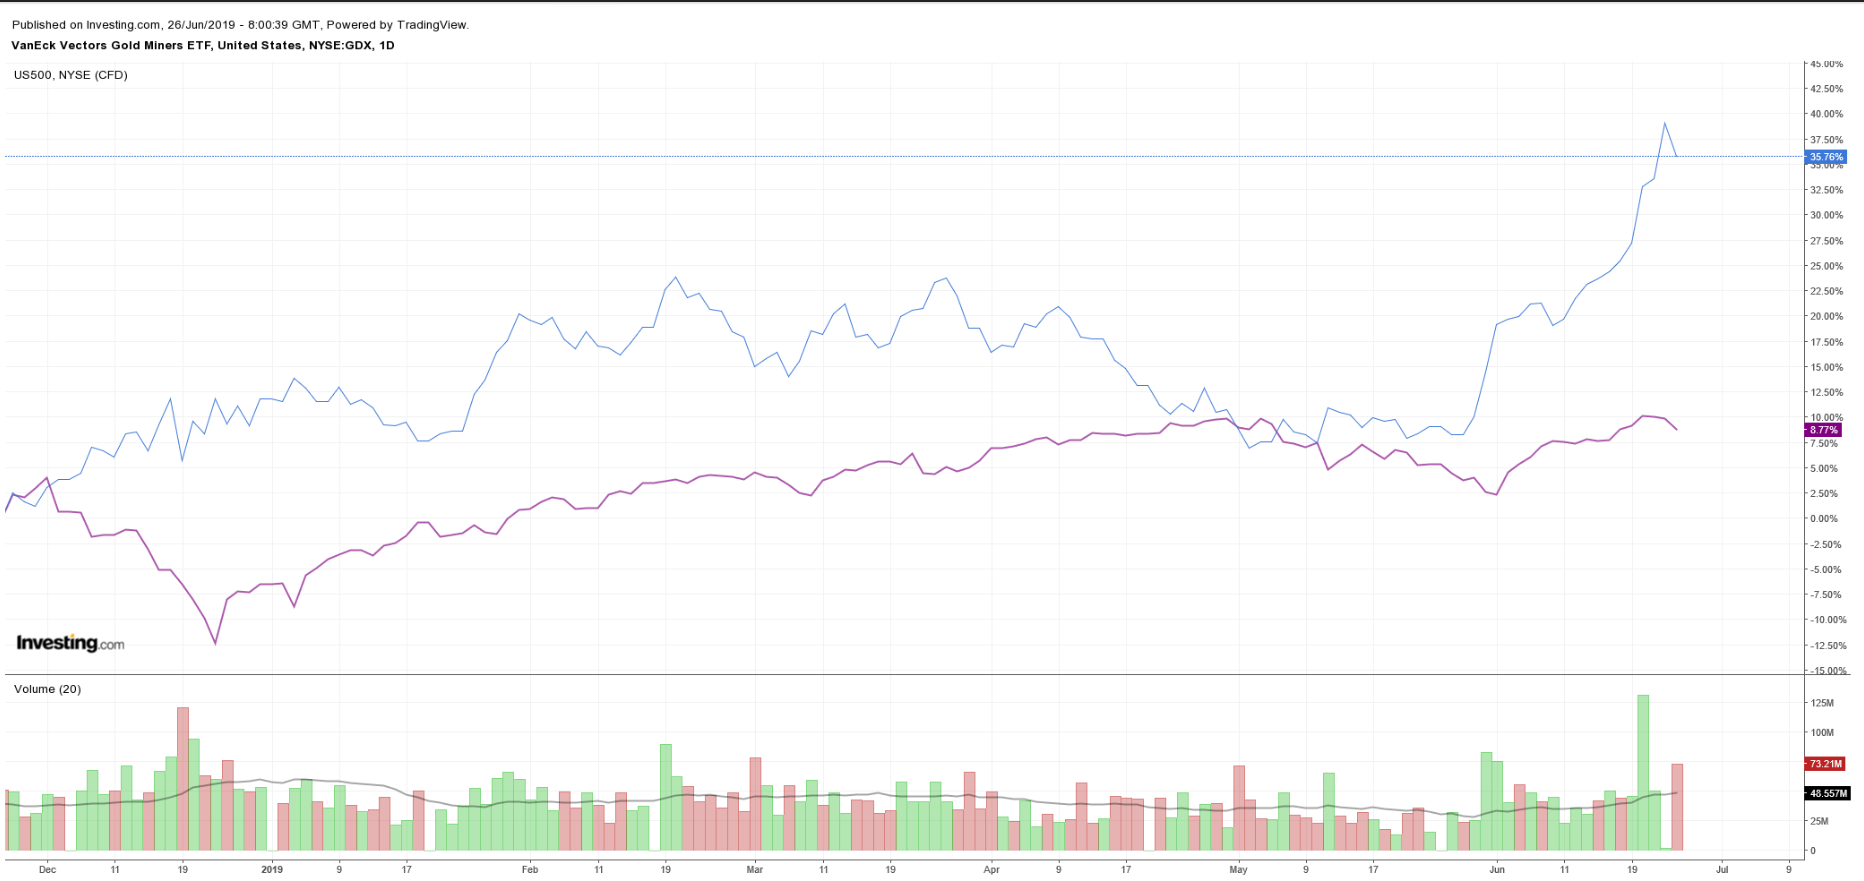
As well, gold-related ETFs have soared in tandem with the yellow metal over the past month. The VanEck Vectors Gold Miners ETF (NYSE:GDX) is up 24.5%, compared to the S&P 500’s 3% gain over the same period.
These three gold miners look set to see their share prices become more lusterous:
1. Newmont Goldcorp: June Gains, 15%
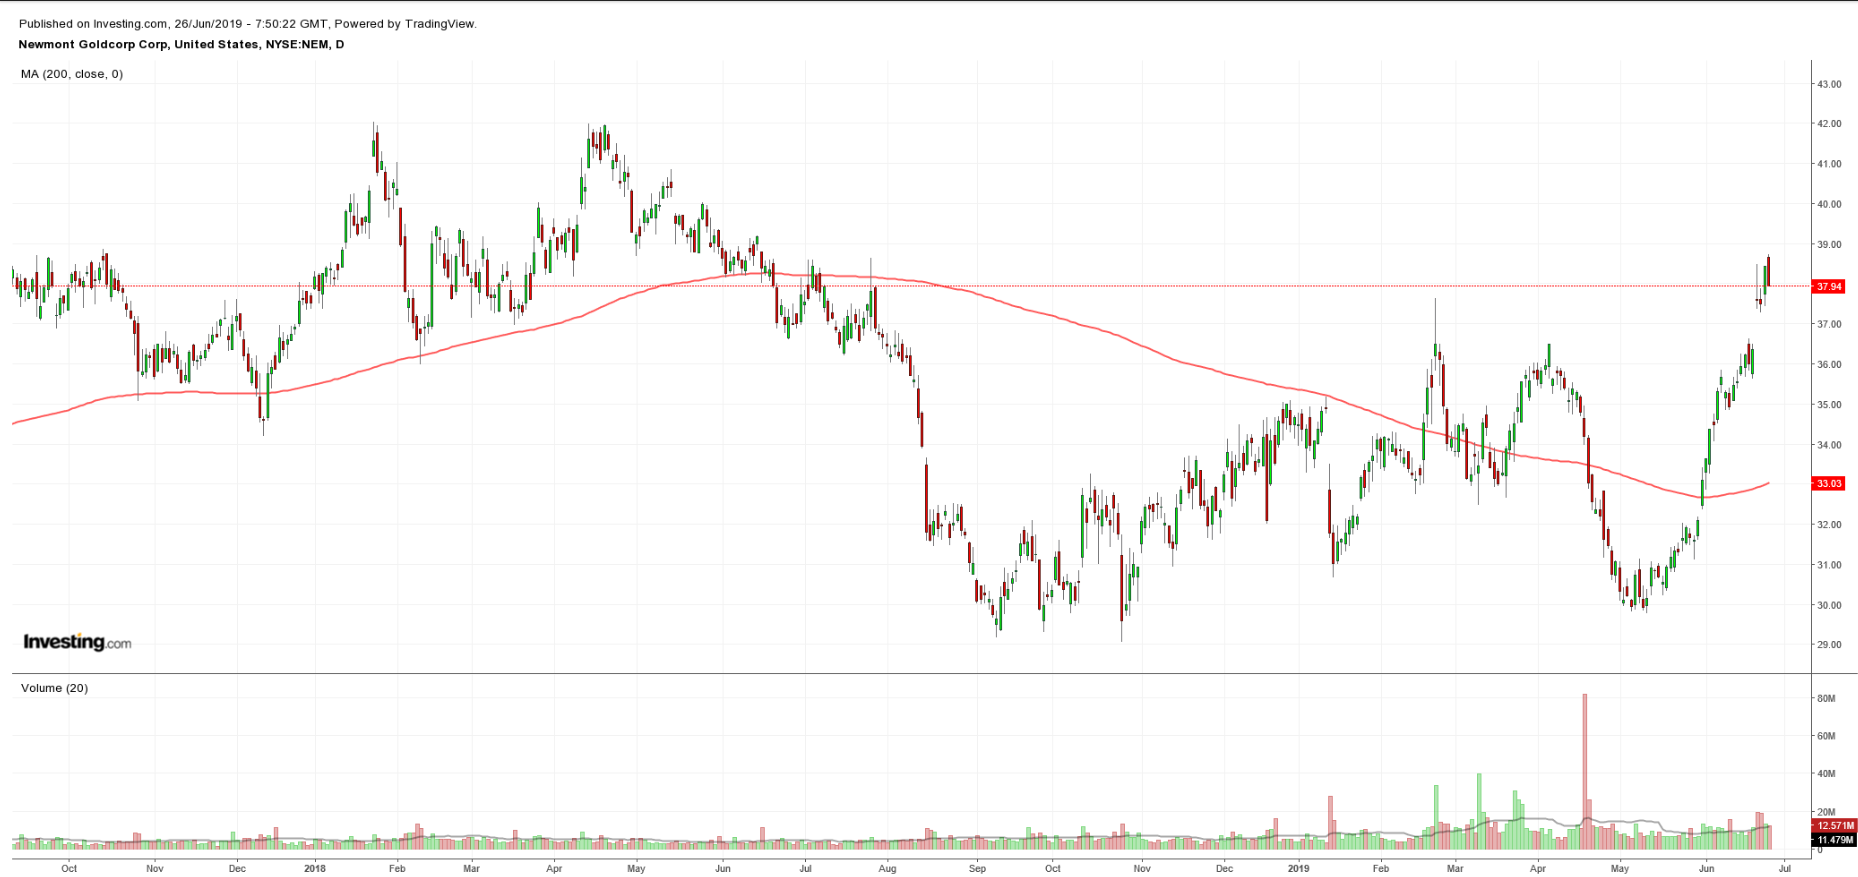
Newmont Goldcorp (NYSE:NEM), the new gold giant created after the merger of Newmont Mining and Goldcorp was completed in April, is the world’s largest gold producer by market value, output and reserves. Shares, which have gained around 19% over the past month, closed at $38.05 last night after hitting a fresh 52-week high of $38.72.
The company ended the first quarter of 2019 with roughly $3.5 billion of cash in hand, while net debt declined to $800 million from roughly $1 billion in the year-ago quarter, as it successfully streamlined business operations within the newly merged entity.
We anticipate the positive trend in Newmont Goldcorp to continue thanks to its world-class portfolio of assets anchored in favorable gold mining regions in North America, South America and Australia.
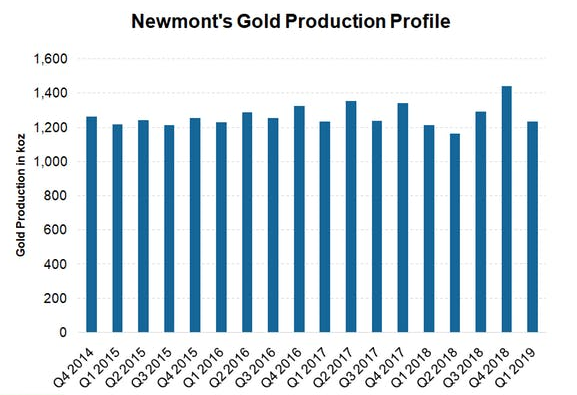
The corporation is well-placed to benefit from the recent spike in prices of the yellow metal. It expects attributable gold production of 5.2 million ounces in 2019 and the all-in sustaining costs of producing the precious metal to be $935 per ounce for 2019.
2. Barrick Gold: June Gains, 29%
Shares of Toronto-based Barrick Gold (NYSE:GOLD) the world's No. 2 gold miner, have been on a tear lately, rising 34% over the past month. The stock hit a 52-week high of $16.44 yesterday before ending at $15.95.
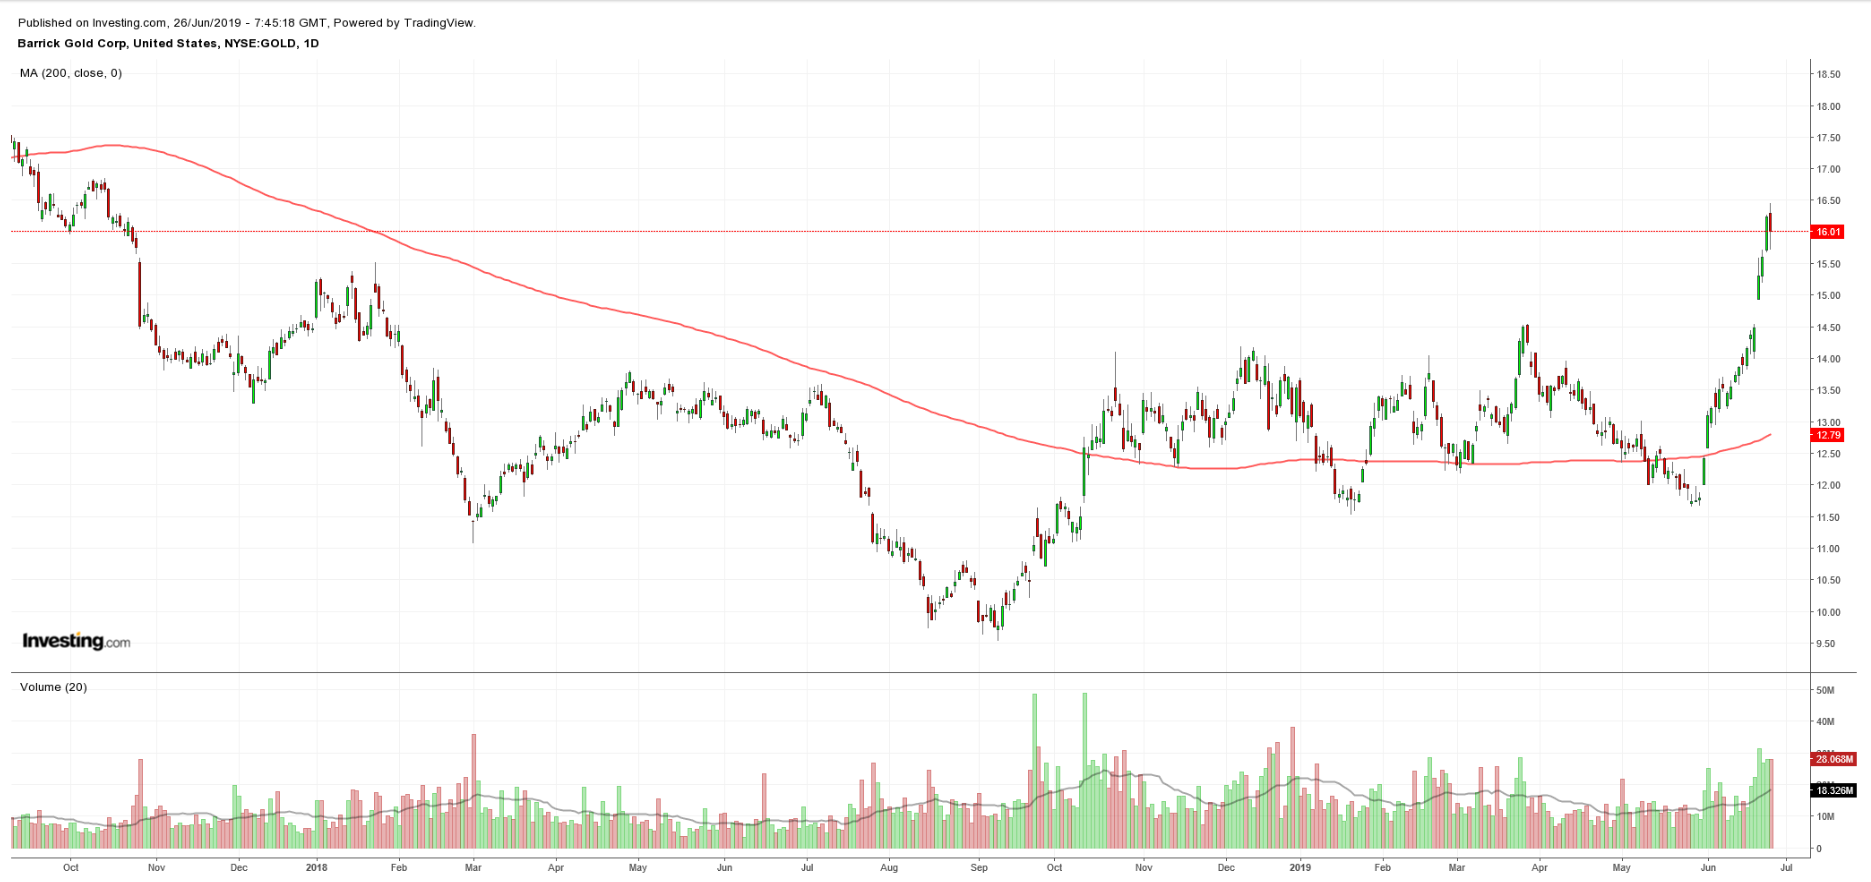
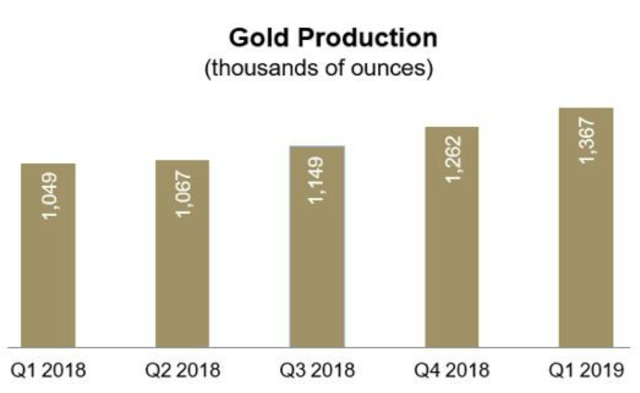
Barrick Gold’s stock looks set to extend its recent run of strong gains as it benefits from improving fundamentals. Gold output has been on a steady uptrend over the last five quarters. It is forecast to produce 5.1 million to 5.6 million ounces of the precious metal in 2019, with all-in sustaining costs estimated in a range between $870 and $920 per ounce.
In addition, the recent merger with Randgold Resources—completed in September 2018—has put it in control of half of the world’s top 10 gold mines. Taking all this into consideration, Barrick Gold remains a good bet going forward as rising gold prices and ongoing cost-cutting efforts are likely to boost the bottom line in the quarters ahead.
3. AngloGold Ashanti: June Gains, 30%
AngloGold Ashanti (NYSE:AU), headquartered in Johannesburg, South Africa, is the third-largest gold producer worldwide. Its impressive portfolio includes fourteen operations in nine countries located in key gold-mining regions around the world, mainly in Africa and Australia.
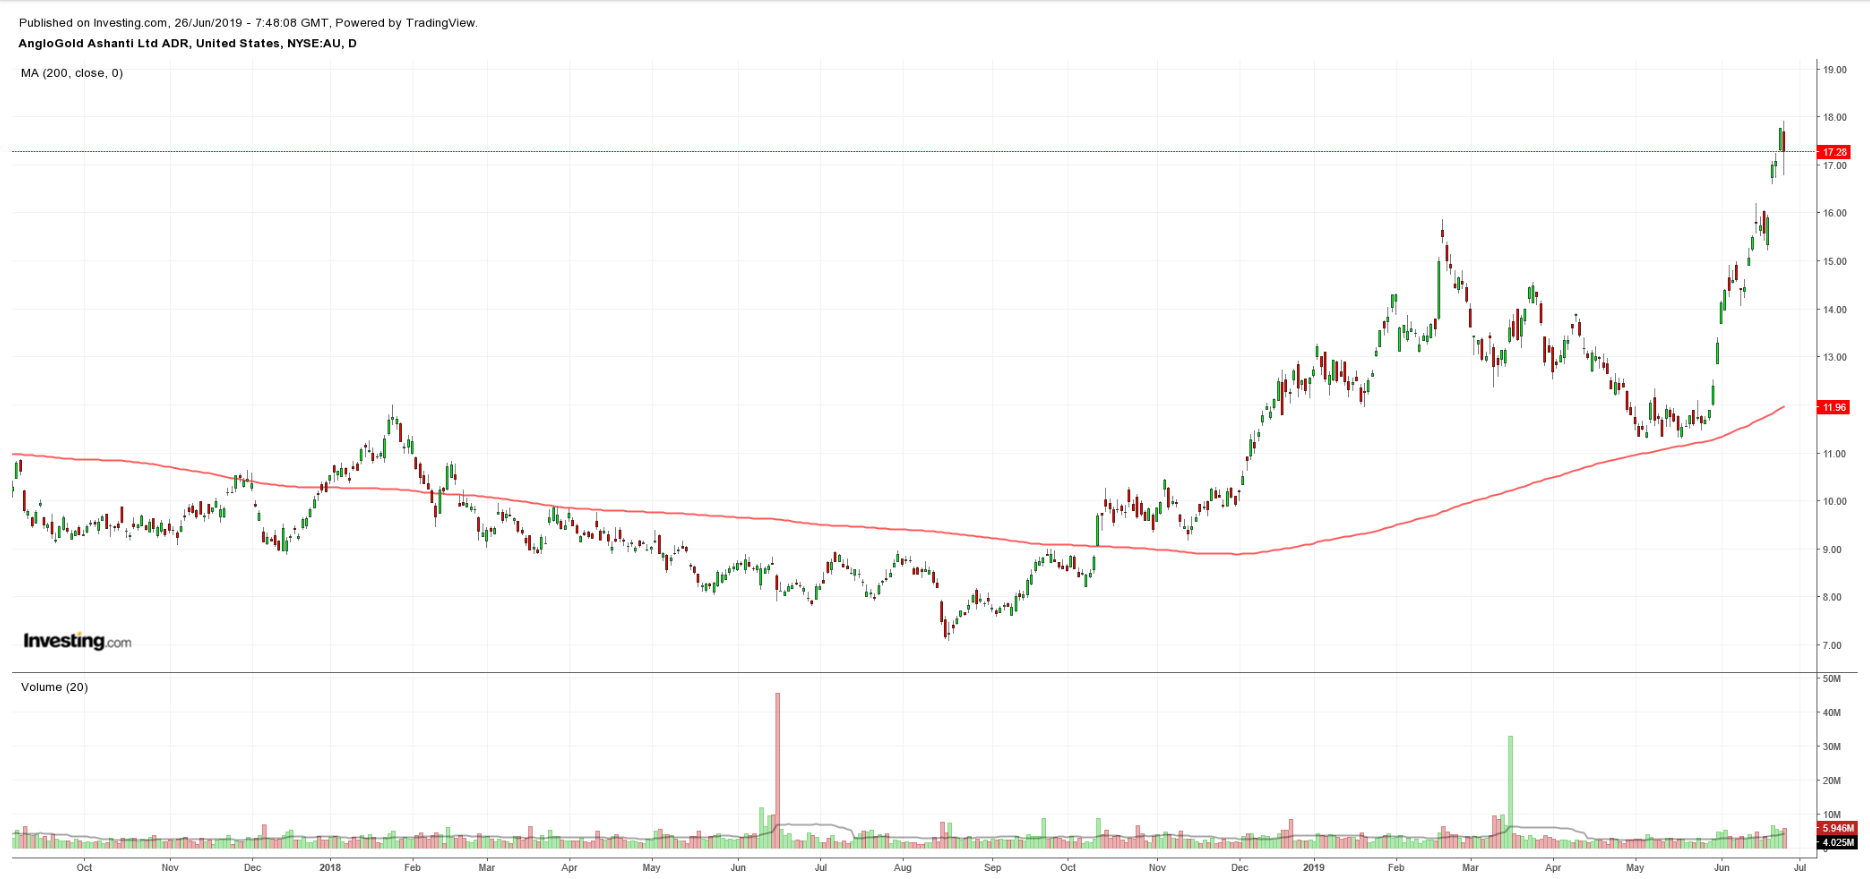
Shares of AngloGold Ashanti have greatly outperformed their peers over the past month, with the stock gaining about 49%. It settled at $17.27 yesterday after touching a 52-week high of $17.92 earlier in the session.
The company produced 3.4 million ounces of gold in 2018 with all-in sustaining costs totaling $968 per ounce. For 2019, it expects to produce 3.25 million to 3.45 million ounces of the precious metal. All-in sustaining costs are estimated to be between $935 and $995 an ounce.

AngloGold Ashanti’s robust performance looks set to continue as it has managed to transform itself in recent years thanks to efforts aimed at increasing efficiencies and competitiveness, improving margins, as well as containing operating and overhead costs.
