Investing.com’s stocks of the week
US Treasuries were one of the stories of 2014. Not one pundit or economist surveyed expected them to rise in price in 2014. Yet they did so with a vengeance. If the US dollar or Shanghai Composite did not break out of their funks it may have been the story of the year. But when you look at the long term trend US treasury bonds have been rising for over 20 years.
One of the first things you learn as a trader is ‘the trend is your friend’. As a technician this extends to the view that the trend is in tact until it confirms a change. But as a pundit or economist, picking a top is more fun and gains attention. So maybe you should not be too surprised that none got it right.

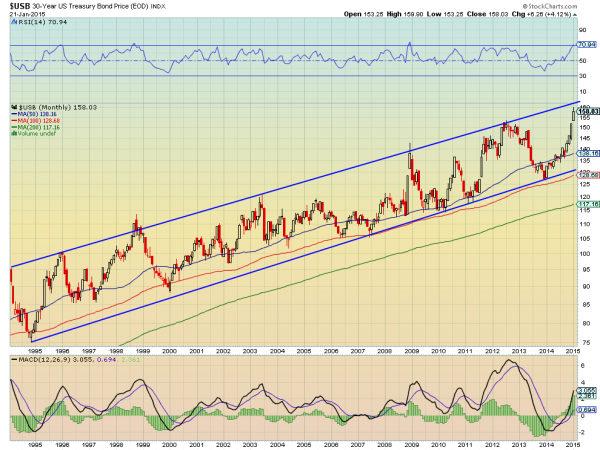
Looking at the monthly chart of US Treasury prices above one thing is clear. The long term trend is up. Prices have been rising in a channel since at least 1994. And that channel has a lot of room to the downside before bond prices can prove that the long term trend is over. It is unlikely to happen this year.
There is a little more that can be gleaned from the chart though. With the price at the top of the channel and the momentum indicator RSI entering overbought territory, it should surprise no one if prices started 2015 by falling. A reversion to the 50 month SMA or even the 100 month SMA has been the norm when it starts falling. What would be a bigger surprise is if the price broke the channel to the upside and continued.

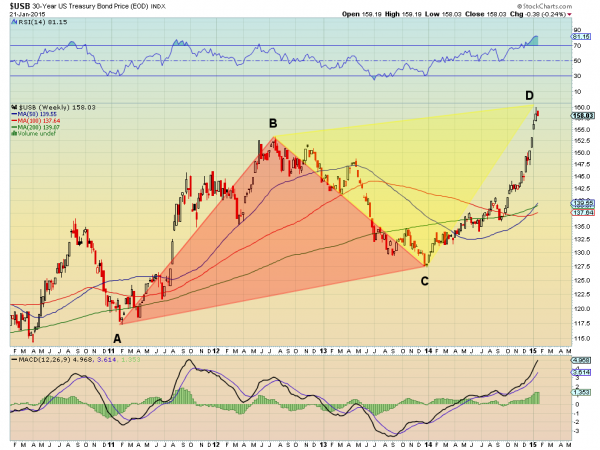
So it is a bit more important to look at the intermediate term chart for Treasuries. The weekly chart also shows the rocket ship higher in 2014. But it also shows an AB=CD pattern that has completed with the recent touch at 160. On this shorter time frame the RSI is also overbought and showing signs of rolling over. The MACD is also above levels where it has turned back lower over the past 5 years.
Finally, look how extended the price is from the moving averages. It has only been more extended from those moving averages than it is now twice in the last 20 years, once during the financial crisis, and then again in mid 2011. More signs that a pullback could be brewing.
So US Treasuries look as if they may finally come back to earth. This does not mean that they will reverse the 20 year trend higher. Just a pullback in the uptrend for the time being until they break below the monthly channel. Play the short term pullback (when it starts) if you like but watch 140 and 133 carefully if they come into play. A break of those levels could mean a much larger downside.
