When I recently told my subscribers to go into light “sell mode” for gold at $1305, I wasn’t calling a top. After staging an enormous rally of about $130 an ounce, gold had simply arrived at sell-side HSR (horizontal support and resistance).
Professional gold investors must book light profits regularly. They also need to rebuy those positions on significant price weakness, without making wild statements about the major trend.
That’s because gold is better defined as the ultimate asset than a market. The ultimate asset should be treated like a great garden; hedges are pruned, the lawn gets mowed, but in the big picture the overall garden does not change very much.
Gardens are not bot and sold like cattle. It’s important to treat gold in a similar way.
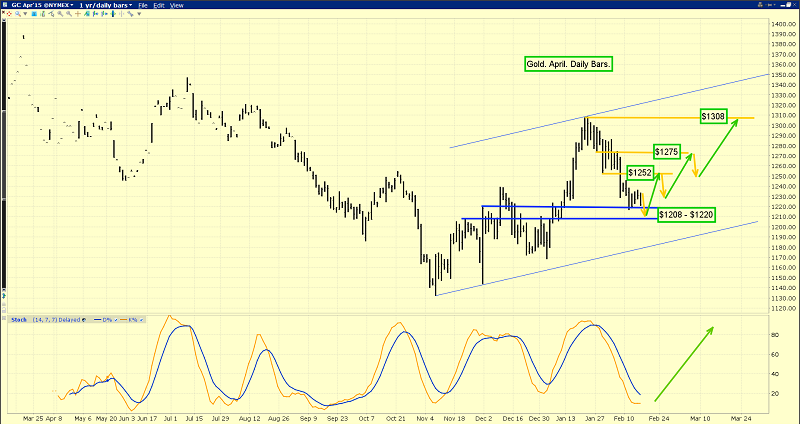
That’s the daily gold chart. Price has meandered down from $1305 to the $1208 - $1220 buy-side HSR zone that I’ve highlighted.
Professional investors are light buyers now, while amateurs are trying to predict the next big directional move.
Note the position of the 14,7,7 Stochastics indicator, which I sometimes refer to as “Tony the Tiger”. The lead line is at about 10 now. Against the background of roughly a hundred dollars of price weakness, Tony is clearly roaring “Buy!”
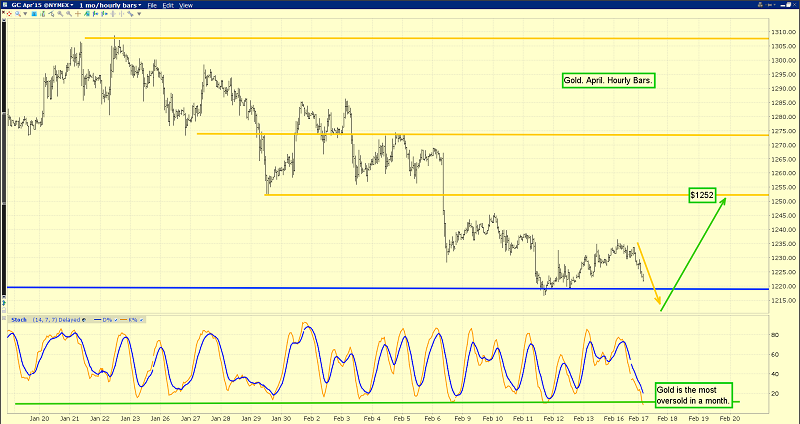
That’s the hourly bars chart. Gold is at the most oversold position it’s been in for the past month.
Tomorrow’s FOMC minutes release could easily push gold to the lower part of the $1208 - $1220 HSR zone. My suggestion to the gold community is to place light buy orders now, in the $1195 - $1215 area.
I’ve argued that the link between gold and the US dollar index has greatly weakened, and is arguably completely broken.
In my professional opinion, the dollar versus the rupee is the fiat chart that matters most for gold price discovery now, and for the next one hundred years.
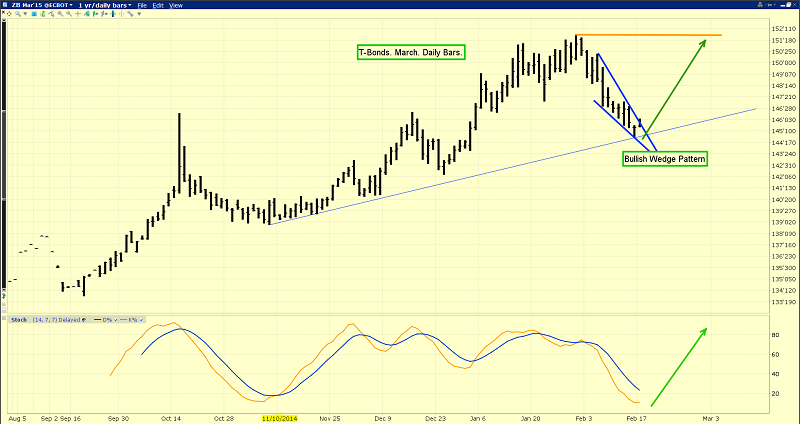
Regardless, the US T-bond chart is still very important to gold price discovery. That’s the daily T-bond chart.
After surging to the 151 area, the T-bond has drifted lower. The price action is very similar to the gold chart, with a trough in November, and a high in late January.
Note the position of the 14,7,7 Stochastics series. It’s almost identical to gold! The lead line is at about 10. I think Janet Yellen will hike rates sometime between April and October, but she is likely to be emphatic that her focus is on the short end of the curve.
To hedge against rate hikes, investors can buy small quantities of put options on the T-bond in April.
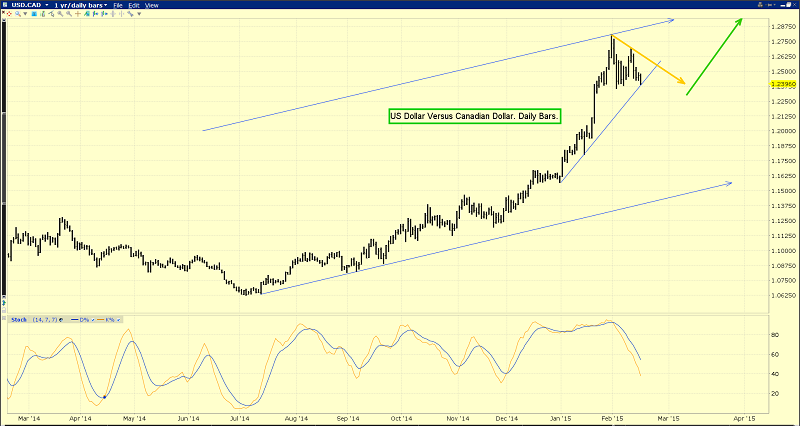
I’ve predicted that gold could make a new low in 2015, while Janet hikes rates, the dollar rallies, and gold stocks surge higher. That’s the daily chart of the US dollar versus the Canadian dollar. I made that prediction about gold stocks because most mining companies trade on the Toronto Stock Exchange, in Canadian dollars.
Their costs are in Canadian or Australian dollars, and their revenues are mainly in US dollars. Gold-mining companies have also generally worked very hard over the past two years to reduce costs. At this point in time, the US dollar rally, the cost cutting, and the drop in fuel prices has created a near-ideal situation for gold stocks.
After the current pause, I expect the US dollar to continue to rally, against both Canadian and Australian fiat. Thus, there should be rising profits for most gold companies, even if gold moves slightly lower as the first rate hikes are announced.
In 1980, the dollar staged a huge rally against gold as rates soared, and gold stocks surged higher. I don’t expect Janet to hike rates very much in 2015 or 2016. In a nutshell, the world gold market today bares only modest resemblance to the 1970s bull market.
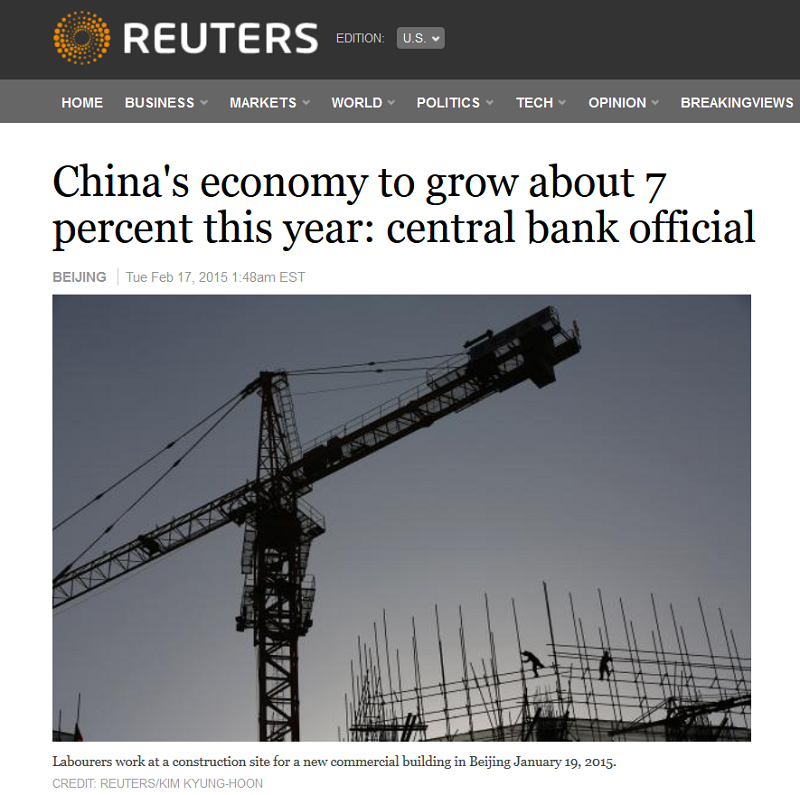
I have no concerns about the health of the Chinese economy. I’m predicting that 8% growth in jewellery demand will continue in China for years to come, coupled with even bigger growth in India. Therefore, any Western gold supply that comes onto the market because of Janet’s light rate hikes, should be easily absorbed by India and China.
While rate hikes are likely great news for gold stocks, the Dow could crash as they are unveiled, partly because most traders don’t believe they will happen!
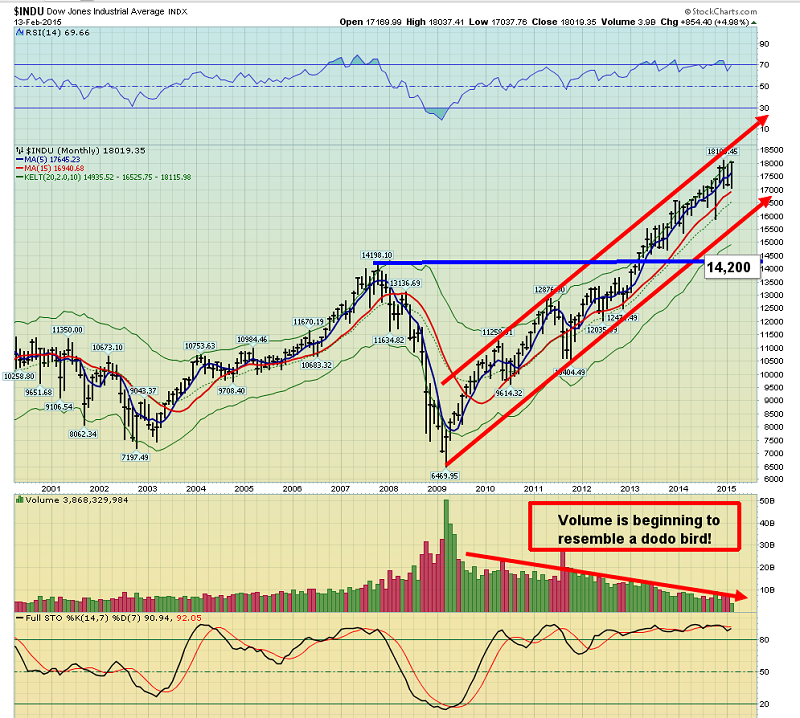
That’s the monthly chart of the Dow. Volume is going the way of the dodo bird, while traders are living in a bit of a fantasy world about rate hikes. That’s the stuff that major crashes are made of! I bought a small amount of dividend-oriented US stock during the October sell-off, but this market carries great danger for price-chasers.
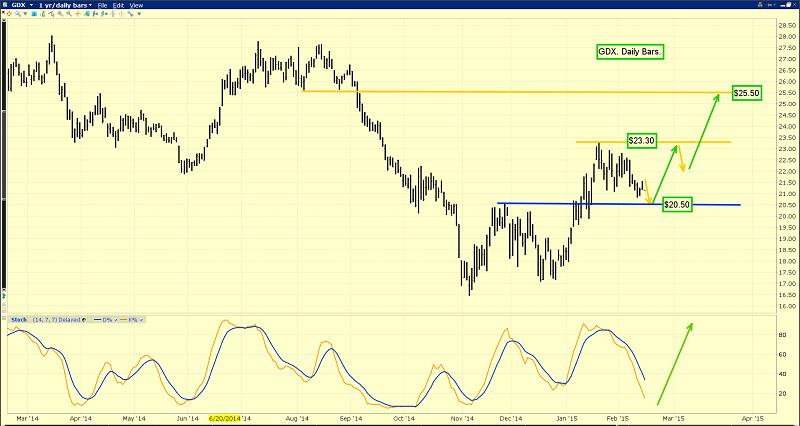
That’s the (ARCA:GDX) daily chart. I expect institutions to be buyers in the $20.50 area, if volatility from the FOMC minutes release causes GDX to trade there. Note the superb position of the 14,7,7 Stochastics series. I’m a buyer here, and a light seller at $23.30 and $25.50.
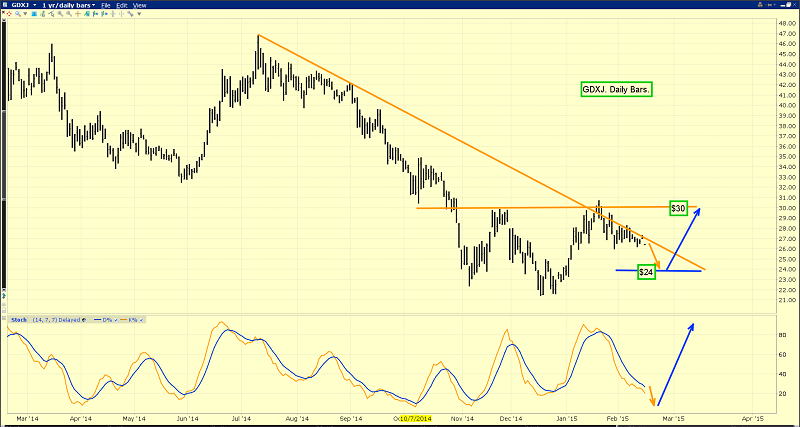
That’s the (ARCA:GDXJ) chart. It’s more volatile than GDX, and the minutes release could send it as low as $24, where investors should be decent buyers, with a target price of $30. If the trade plays out, that’s a solid gain of about 25%.
When looking at the big picture for China, India, the dollar, and rate hikes, it’s pretty clear that in 2015, all the road signs are pointed directly at gold stocks!
Special Offer For Gold-Eagle Readers:Please send me an Email to freereports4@gracelandupdates.comand I’ll send you my free “Gold Stock Covered Calls” report! For investors who want to take a toe in the water approach to gold stocks at this point in time, a covered call option strategy can boost reward in the short term. I reveal my top five current favourite plays!
Stewart Thomson is a retired Merrill Lynch broker. Stewart writes the Graceland Updates daily between 4am-7am. They are sent out around 8am-9am. The newsletter is attractively priced and the format is a unique numbered point form. Giving clarity of each point and saving valuable reading time.
Risks, Disclaimers, Legal
Stewart Thomson is no longer an investment advisor. The information provided by Stewart and Graceland Updates is for general information purposes only. Before taking any action on any investment, it is imperative that you consult with multiple properly licensed, experienced and qualified investment advisors and get numerous opinions before taking any action. Your minimum risk on any investment in the world is: 100% loss of all your money. You may be taking or preparing to take leveraged positions in investments and not know it, exposing yourself to unlimited risks. This is highly concerning if you are an investor in any derivatives products. There is an approx $700 trillion OTC Derivatives Iceberg with a tiny portion written off officially. The bottom line:
Are You Prepared?
