
Turning Points For The Week Of May 20-24
Summary
- While corporate revenue growth is still positive, earnings are weaker, indicating margin compression.
- New orders for consumer durable goods orders are still strong; non-defense capital goods are a bit weaker.
- The yield curve continues to be the primary recession indicator that is still positive.
The purpose of the Turning Points Newsletter is to look at the long-leading, leading, and coincidental economic indicators to determine if the economic trajectory has changed from expansion to contraction -- to see if the economy has reached a "Turning Point."
Conclusion: my recession probability for the next six to 12 months is still at 15%, largely due to the yield curve's near inversion. While corporate revenue growth is positive, earnings are down. There's modest Y/Y weakness in new orders for non-defense goods orders. And remember that industrial production is still in a decline.
Long-Leading Indicators
With earnings season nearing the end, let's check-in with Factset to get the final tally (emphasis added):
The blended revenue growth rate for Q1 2019 is 5.3% today, which is slightly above the revenue growth rate of 5.2% last week. Positive revenue surprises reported by companies in the Financial sector were mainly responsible for the slight increase in the overall revenue growth rate during the week. If 5.3% is the final growth rate for the quarter, it will tie the mark for the lowest revenue growth rate for the index since Q2 2017 (also 5.3%). Nine of the eleven sectors are reporting year-over-year growth in revenues, led by the Health Care and Communication Services sectors. Two sectors are reporting a year-over-year decline in revenues, led by the Information Technology sector.
Revenues are growing, they're simply doing so at a slower rate. The decline in technology is significant; tech is the largest component of the SPY and QQQ. The report also noted (emphasis added):
The blended (combines actual results for companies that have reported and estimated results for companies that have yet to report) earnings decline for the first quarter is -0.5% today
.....
Six sectors are reporting year-over-year growth in earnings, led by the Health Care and Utilities sectors. Five sectors are reporting a year-over-year decline in earnings, led by the Energy, Information Technology, and Communication Services sectors.
Over the last few weeks, the sector rotation has turned far more defensive. Part of this is simple sector rotation caused be a weaker technical environment. The earnings data adds further credence to the move is it creates a fundamental reason for making the switch.
The report also notes that companies that earn more than 50% of their revenue from international sales saw an earnings decline:
The blended (combines actual results for companies that have reported and estimated results for companies yet to report) earnings decline for the S&P 500 for Q1 2019 is -0.5%. For companies that generate more than 50% of sales inside the U.S., the blended earnings growth rate is 6.2%. For companies that generate less than 50% of sales inside the U.S., the blended earnings decline is -12.8%.
Business income is the mother's milk of business activity: increasing revenue not only means demand is rising but it also provides income for capital investment and hiring. The opposite is also true. Factset's results show international demand is slowing and domestically, margins are shrinking. This means capital and human resource investment might start to decline. In fact, capital spending is already weaker; while hiring is still strong, non-supervisory hours worked have declined, matching their lowest level in five years. While there's weakness around the edges of the data, there aren't any core problems.
Leading Indicators
On Friday, the Census reported that durable goods orders declined (emphasis added):
New orders for manufactured durable goods in April decreased $5.4 billion or 2.1 percent to $248.4 billion, the U.S. Census Bureau announced today. This decrease, down two of the last three months, followed a 1.7 percent March increase. Excluding transportation, new orders were virtually unchanged. Excluding defense, new orders decreased 2.5 percent. Transportation equipment, also down two of the last three months, drove the decrease, $5.4 billion or 5.9 percent to $85.4 billion.
For our purposes, there are two key numbers in this report: manufacturers new orders for nondefense capital goods and new orders for consumer durable goods:
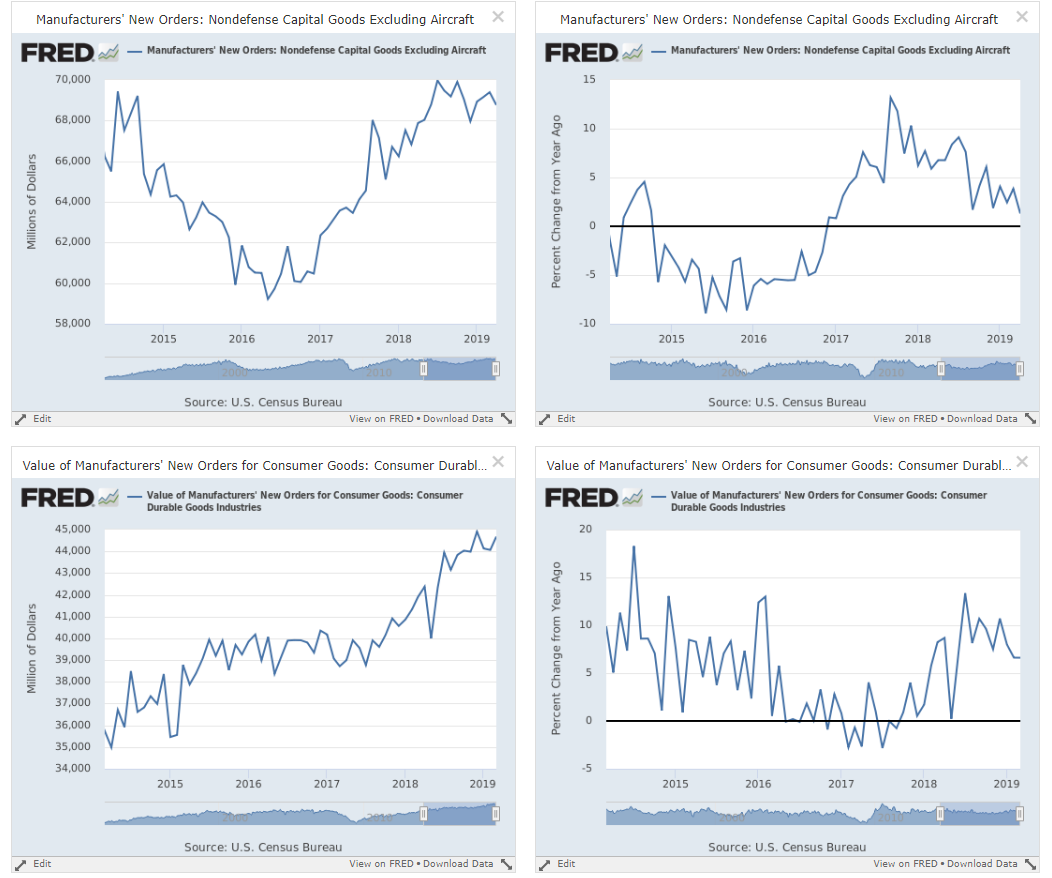
Left charts are total value; the right charts are Y/Y
Nondefense capital goods orders were off modestly. That series has moved sideways for the last year; its Y/Y number is now trending near 0% growth. New orders for consumer durable goods were up modestly; Y/Y numbers are still strong.
The leading employment data is once again strong:

The 4-week moving average (top chart) is (once again) moving lower while the number of people who continue to be on unemployment rolls (lower chart) has moved lower.
The primary data supporting my continued 15% recession probability continues to be the yield curve:
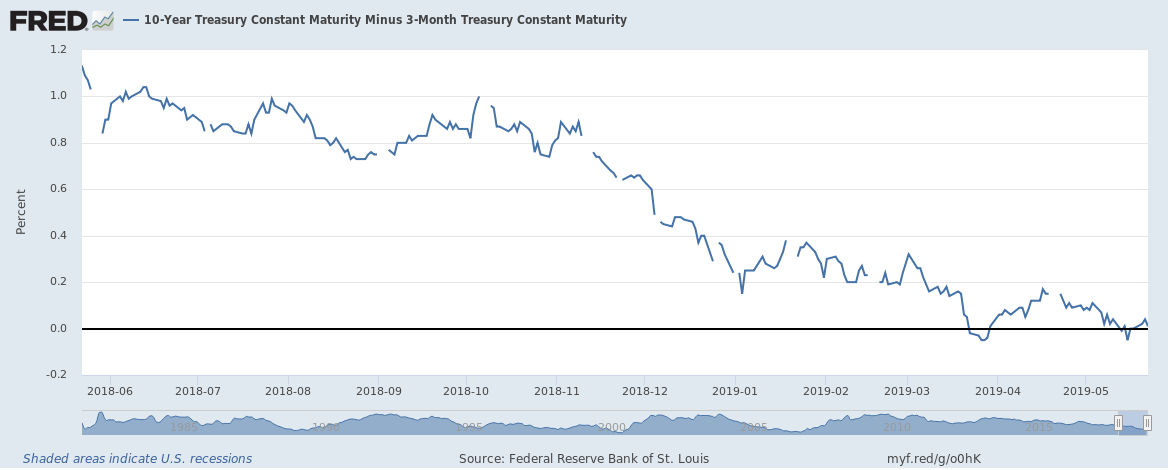
Once again, the 10-Year/3-Month spread inverted and remains very tight.
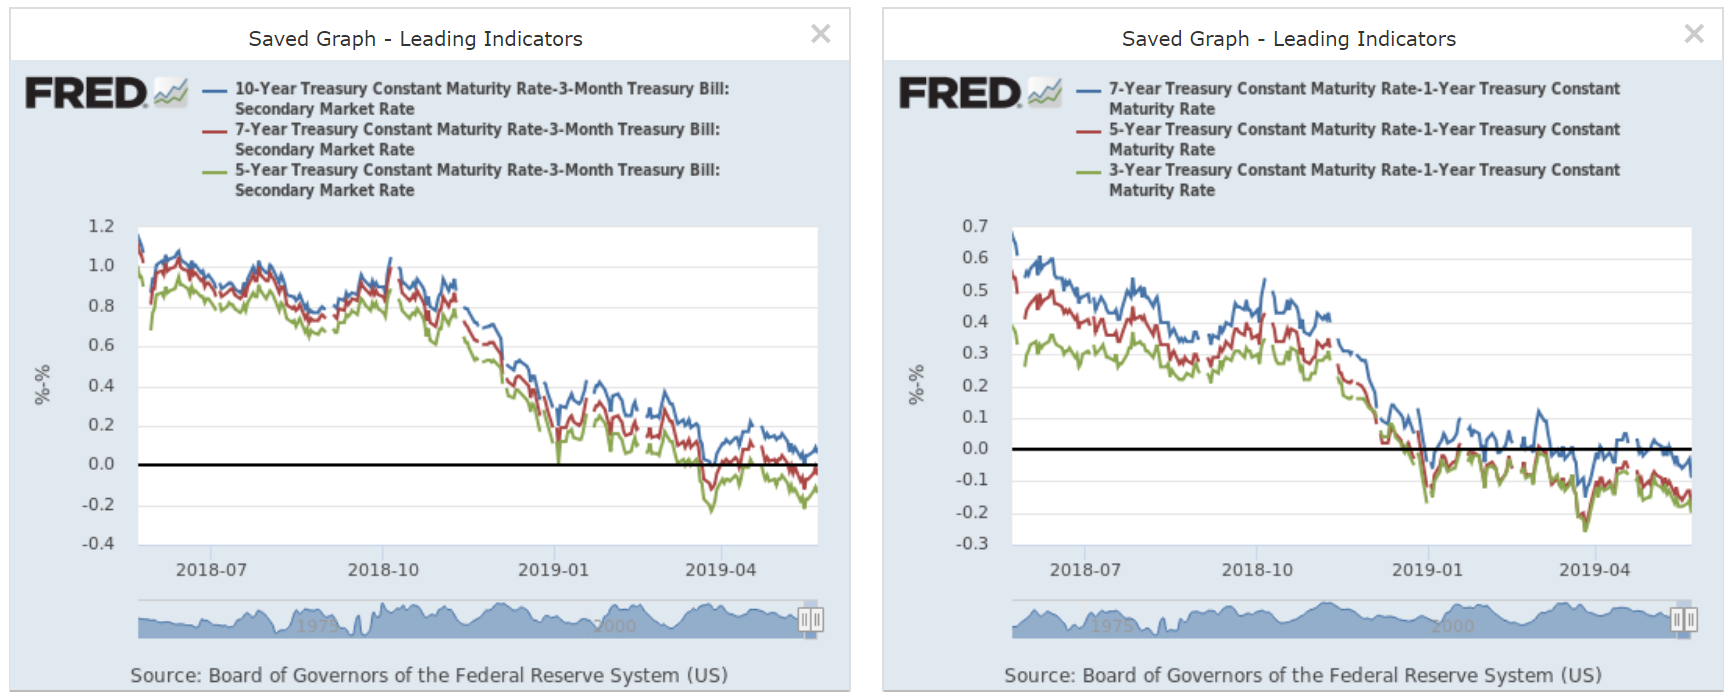
Various measures of the spread in the belly of the curve are either inverted or are flirting with that condition.
Coincidental Indicators
None this week.
Disclosure: I/we have no positions in any stocks mentioned, and no plans to initiate any positions within the next 72 hours. I wrote this article myself, and it expresses my own opinions. I am not receiving compensation for it (other than from Seeking Alpha). I have no business relationship with any company whose stock is mentioned in this article.