Investing.com’s stocks of the week
Summary
- Commercial paper spreads continue to come in.
- While 1-unit housing permits were down, the overall trend is still higher.
- Three under-reported coincidental numbers all point toward continued growth.
The purpose of Turning Points is to break down the leading and coincidental data along with other economic information to determine if the economy is at a "turning point" - a recession.
Leading Indexes
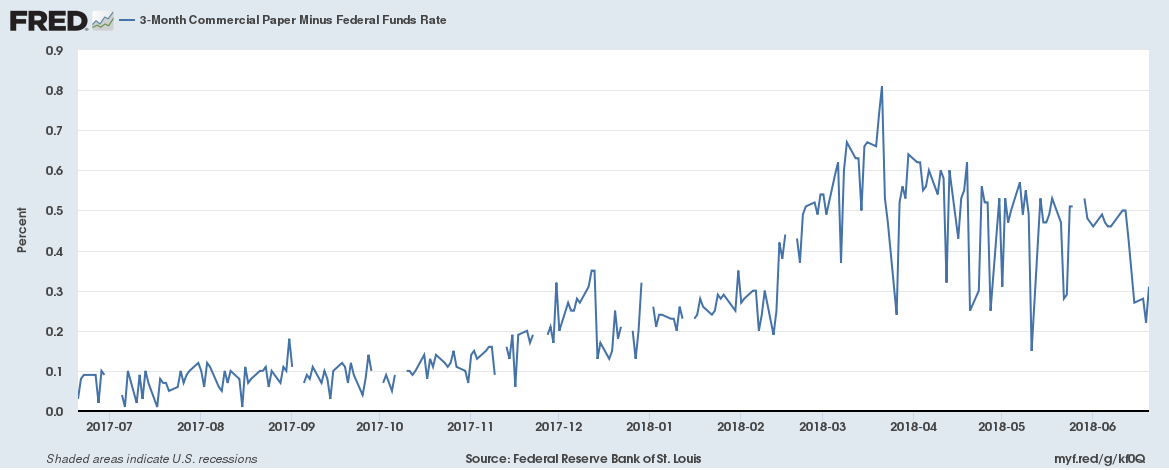
Let's start by looking at the financial market leading indexes, beginning with commercial paper rates:
Commercial paper started to rise at the end of last year but really spiked in March. The new tax law caused a flood of issuance; higher supply = higher rates. But rates have been gradually declining. While they're still somewhat elevated, they have been in a clear downward trend since late March.
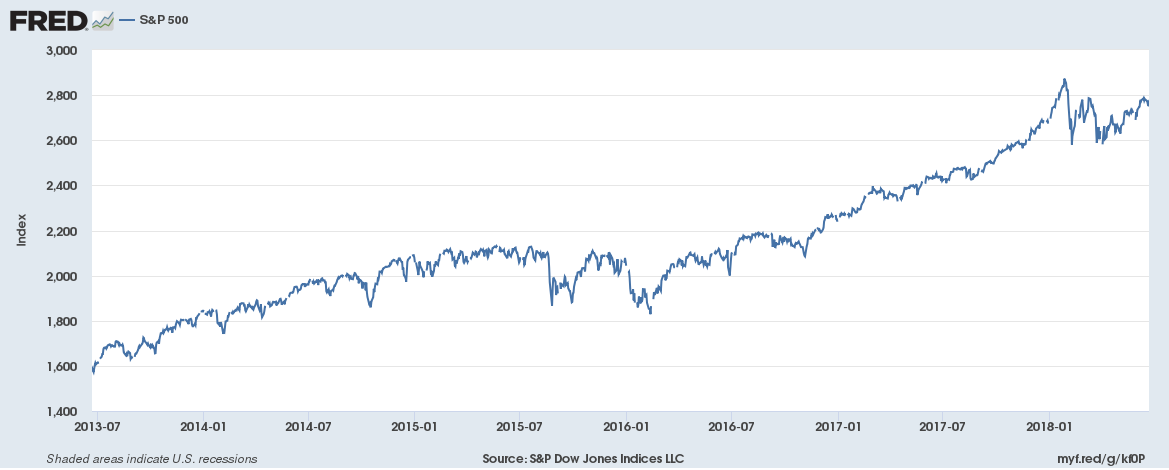
After the sharp drop in the spring, the S&P 500 has moved higher. Although it is still below an all-time high, it also hasn't continued to move lower.
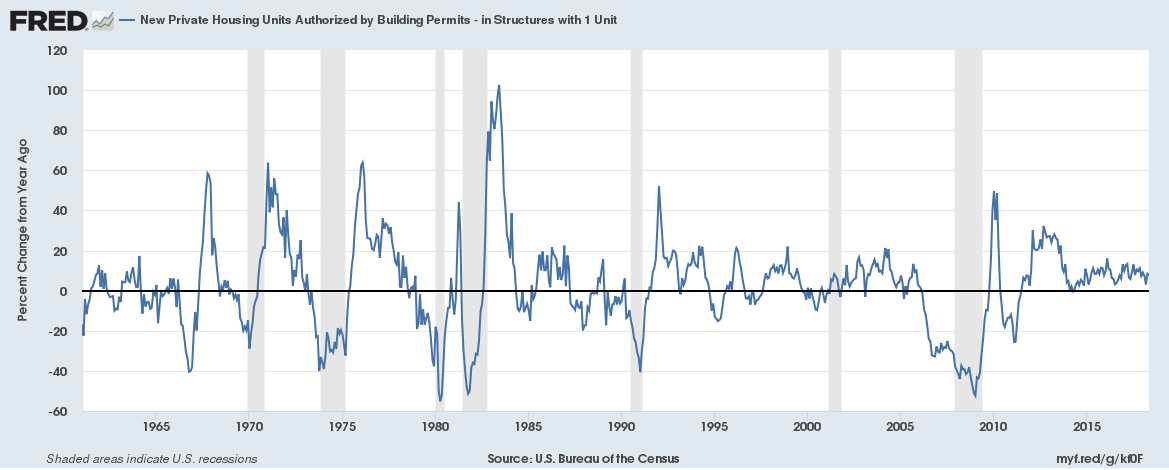
Next, let's turn to this week's building permits report. 1-unit permits were down 2.2% M/M, but up 7.7% Y/Y. Let's look at the data from several perspectives:
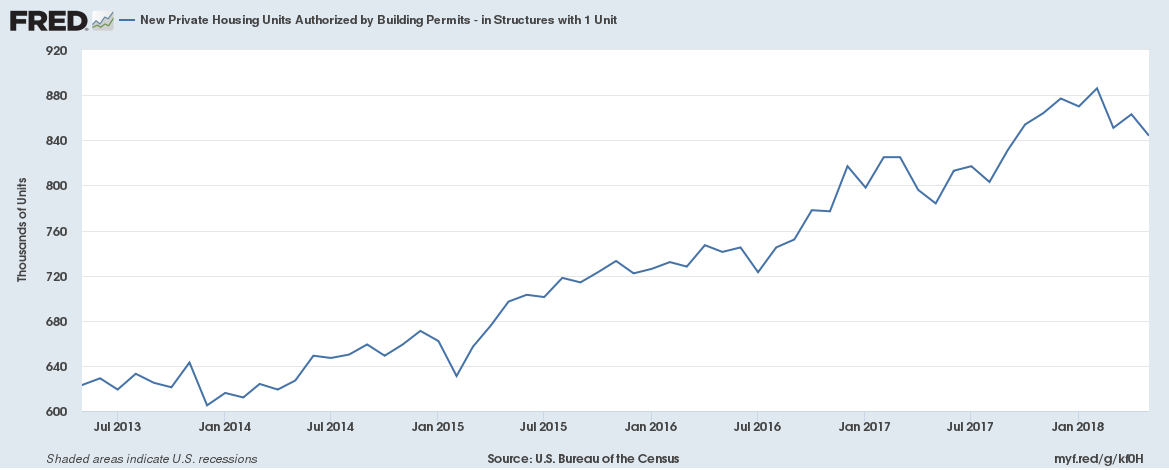
While the national figure is down in three of the last six months, the overall trend is still higher. The latest move lower could be a natural cooling off period from the strong 2017 data.
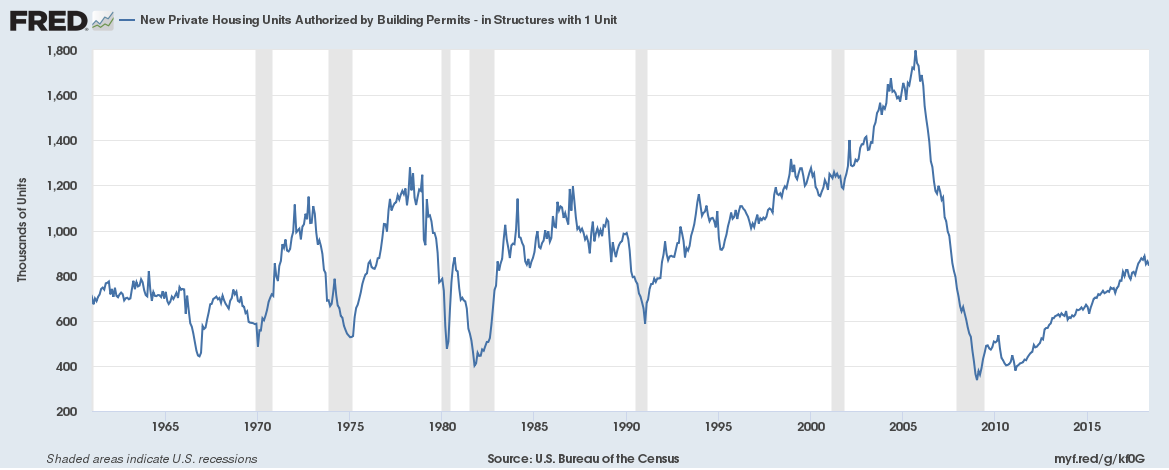
Looking at the data going back to the early 1960s shows that the current pace is not only in a clear uptrend but is also still below levels seen in other expansions.
Although the Y/Y pace is in a modest downtrend, it is still positive.
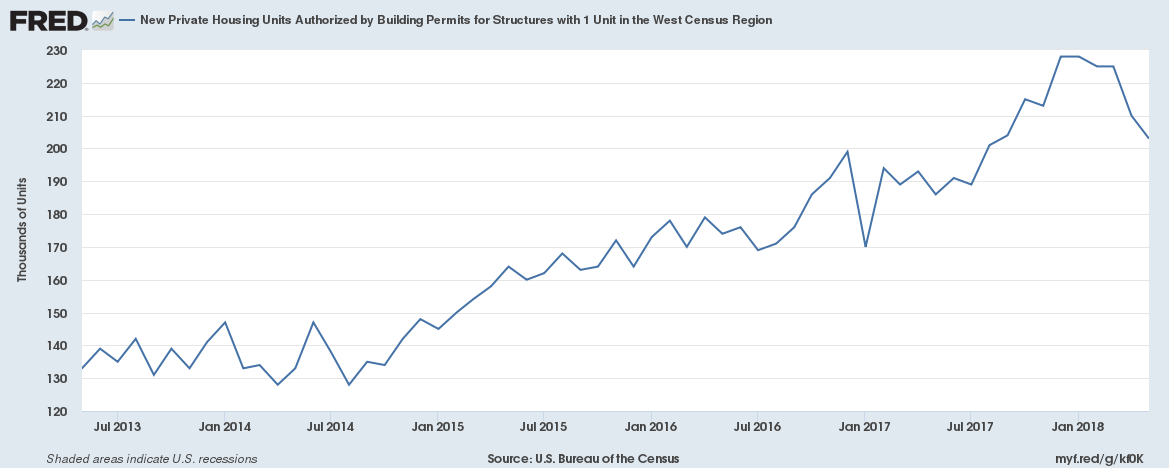
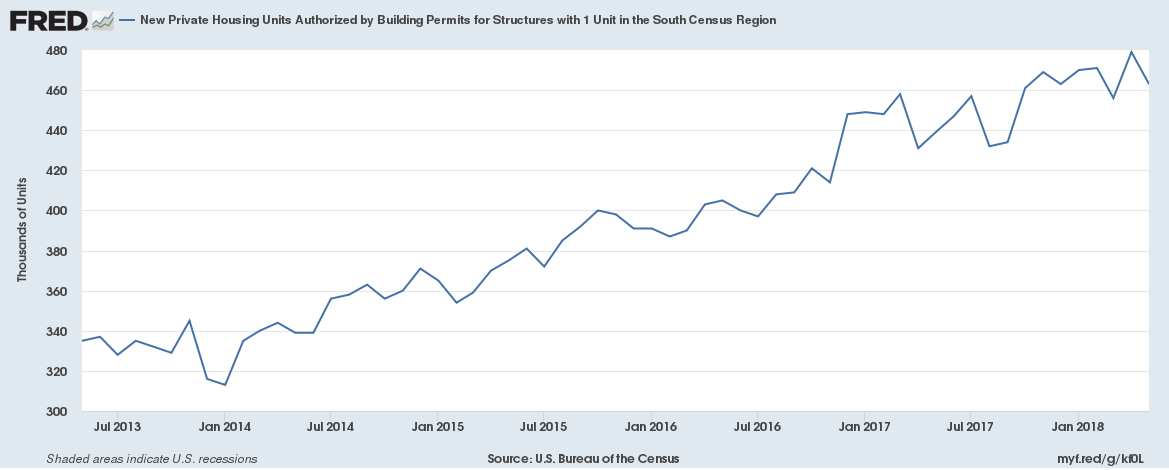
Looking deeper into the report, three regions saw M/M declines: the West (-4.6%; 24% of 1-unit starts), the South (-13.9%; 54% of 1-unit starts), and the Midwest (-1.6%; 14% of 1-unit starts). Only the Northeast saw a rise (+11.8%; 8% of starts).
The West is down five of the last six months. But that drop could be seen as a natural cooling-off period from the strong performance in 2017.
The total number of starts in the South has more or less been moving sideways since January 2017.
Conclusion: The leading indicators all point towards continued growth
Coincidental Indicators
This week, let's take a look at a few lesser-analyzed coincidental numbers, starting with a few wage measures:
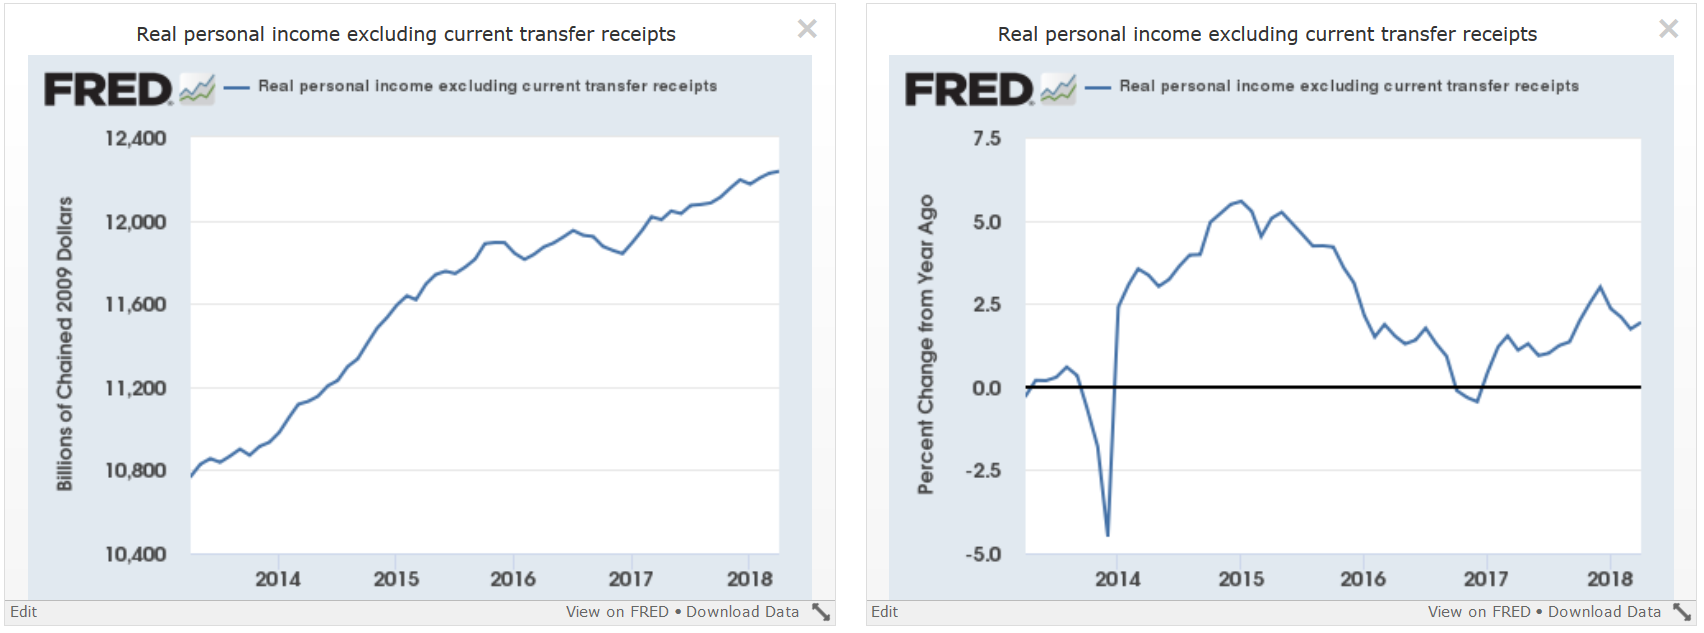
Personal income less transfer payments is derived from the BEA's GDP report - it's the flip-side of the more widely reported expenditure numbers. This number lost some upward momentum in 2016 but has been moving higher since (left chart). The pace of Y/Y increases is moving slightly higher (right chart).
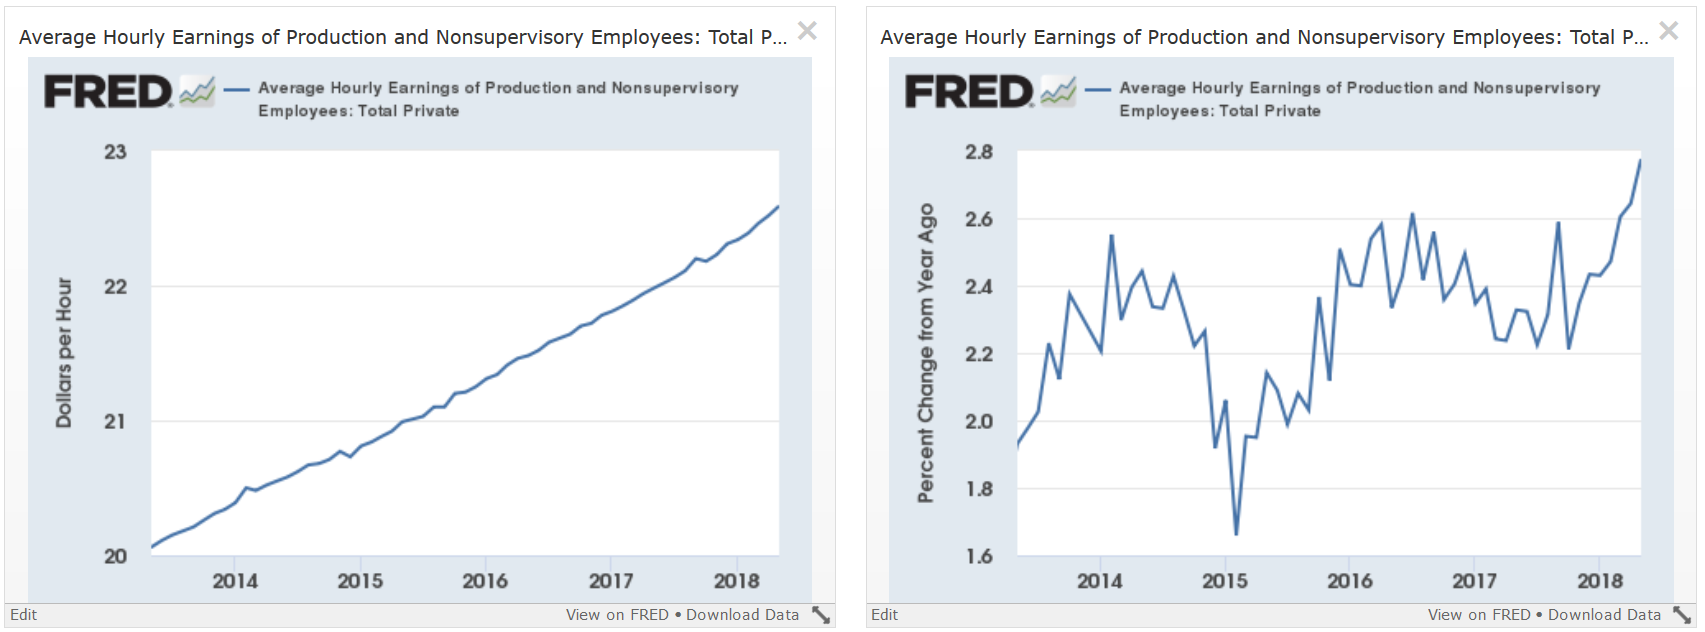
The rate of Y/Y percentage change in the average hourly earnings of production workers just hit a five-year high (right chart).
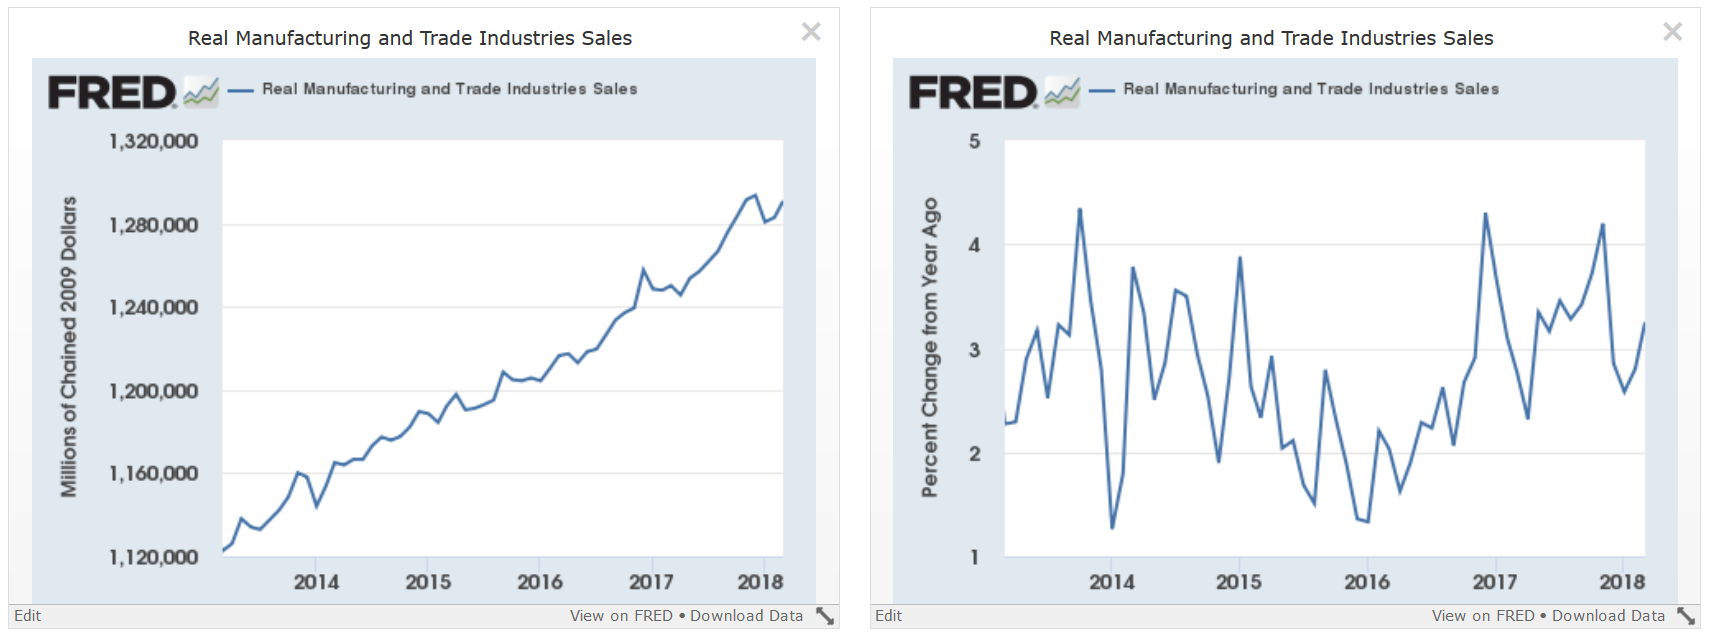
Finally, real manufacturing and trade sales continue to move higher (left chart). The current pace of Y/Y change is slightly above the five-year average (right chart).
Conclusion for the coincidental numbers: All three numbers point towards continued expansion.
Disclosure: I/we have no positions in any stocks mentioned, and no plans to initiate any positions within the next 72 hours.
I wrote this article myself, and it expresses my own opinions. I am not receiving compensation for it (other than from Seeking Alpha). I have no business relationship with any company whose stock is mentioned in this article.

