Summary
The purpose of the Turning Points Newsletter is to look at the long-leading, leading, and coincidental indicators to determine if the economic trajectory has changed from expansion to contraction -- to determine if the economy has reached a "Turning Point."
Conclusion: my recession probability in the next six to 12 months is still at 20%. Corporate income is still declining, the belly of the yield curve is still inverted and the internals of the latest GDP report showed more weakness than the headline number implied.
Long-Leading Indicators
Now that we're deep into earnings season, we have a better idea of the overall revenue and earnings trends. Here's the data from Zacks (emphasis added):
Looking at Q2 as a whole, total S&P 500 earnings are expected to be down -1.3% from the year-earlier period on +4.0% higher revenues. This would follow the -0.1% earnings decline on +4.5% higher revenues in Q1.
And Factset (earnings growth):
The blended revenue growth rate for the second quarter is 4.0% today, which is above the revenue growth rate of 3.6% last week.
The blended (combines actual results for companies that have reported and estimated results for companies that have yet to report) earnings decline for the second quarter is -2.6% today, which is smaller than the earnings decline of -3.4% last week
Factset offers insight into the effect of international trade developments on earnings:
For companies that generate more than 50% of sales inside the U.S., the blended earnings growth rate is 3.2%. For companies that generate less than 50% of sales inside the U.S., the blended earnings decline is -13.6%.
The above data raises interesting questions about the out-performance of the SPY, QQQ, and OEF ETFs relative to the IWC, IWM, and IJH.
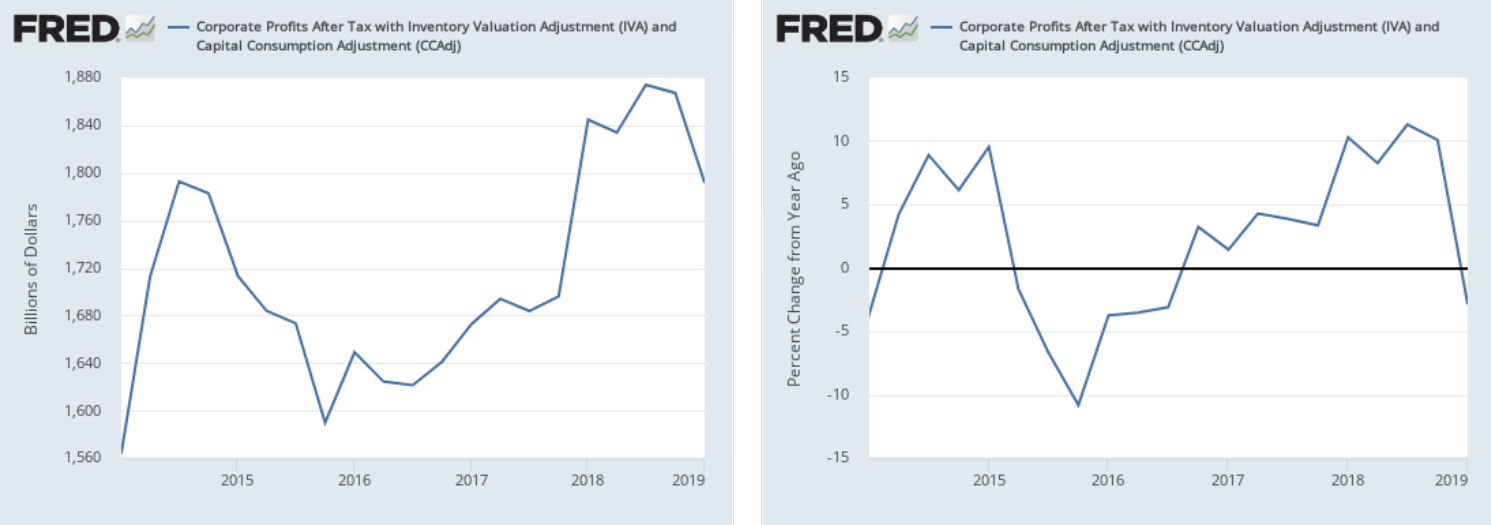
Here's the corporate profits data from the FRED system, which covers a wider swatch of data:

This data only covers 1Q19, but its trajectory jibes with the earnings data.
Long-leading conclusion: Assuming the news continues in its current direction, we'll once again have rising revenue combined with lower earnings. Declining, bottom-line earnings is a modestly bearish development.
Leading Indicators
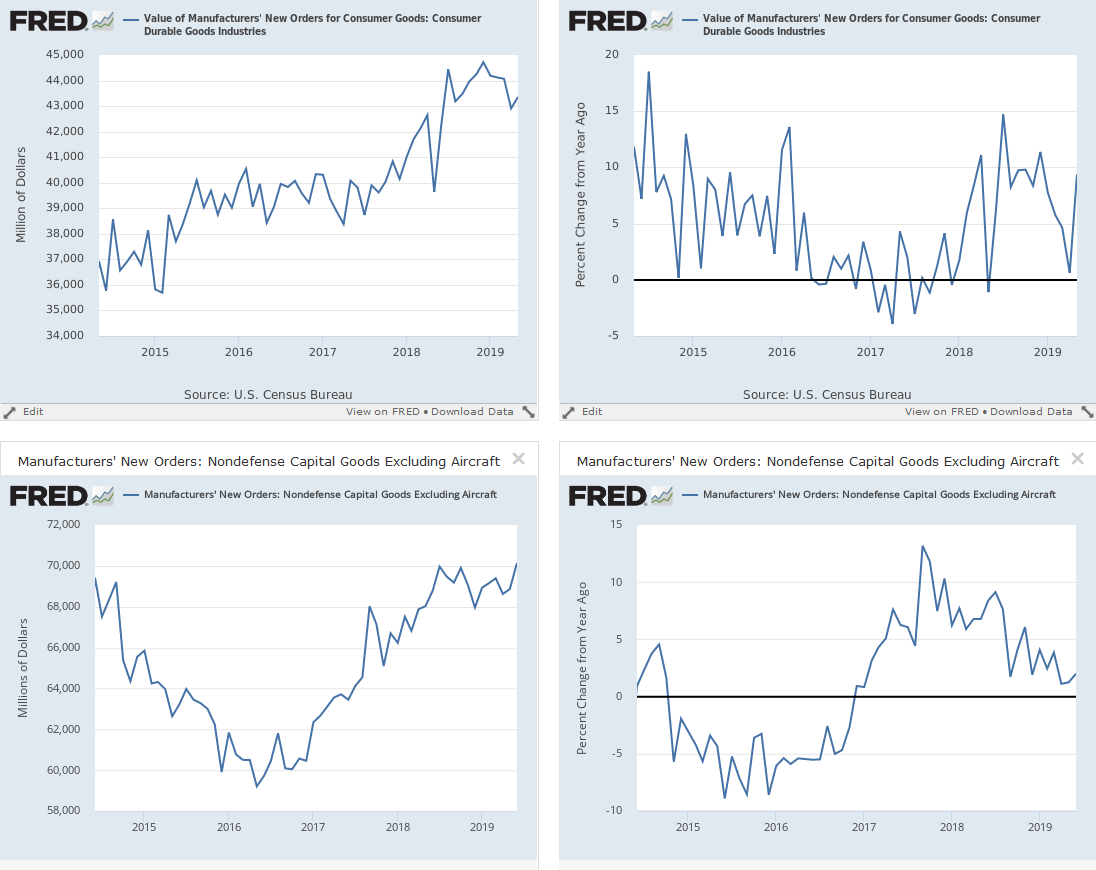
Last week, the Census Bureau released the latest durable goods report, which contained good news in the leading indicator arena. New orders for non-defense capital goods increased by 4.8%; new orders for consumer goods rose 1%. Here are the charts of the data:

The top two charts show the consumer number while the bottom two charts show the business equipment number; the left charts are the absolute number while the right charts show the year-over-year percentage change. The consumer durables number is the first increase this year. As for the business equipment number, the trend is good but it's occurring in an environment of weak industrial production, continued trade concern, and declining business investment. We need at last one more month of data for these indicators to provide a more positive lift.
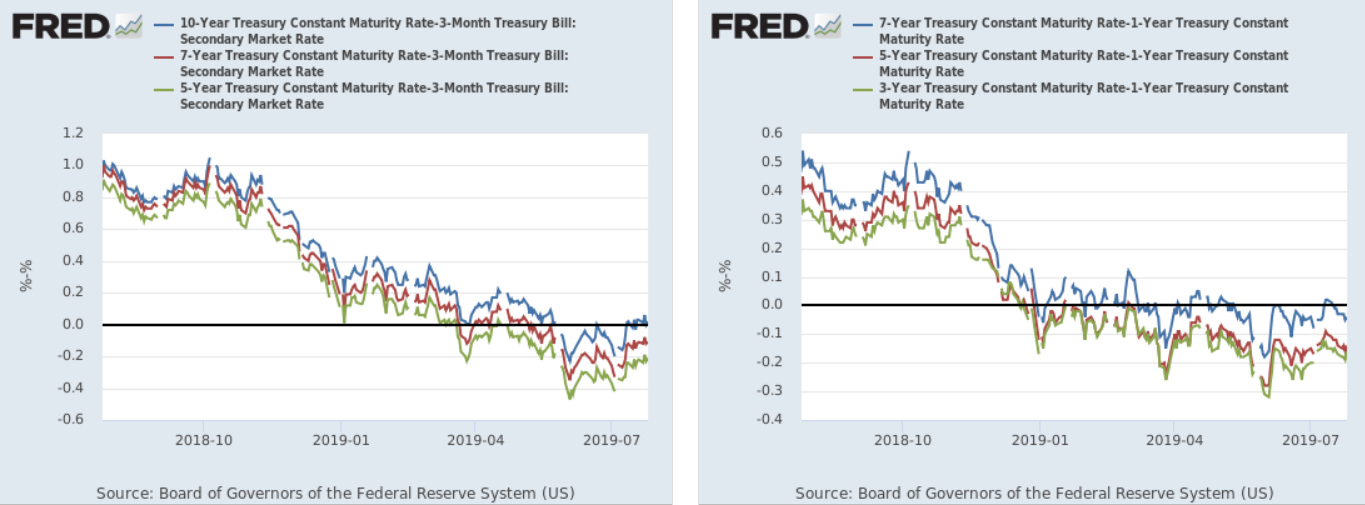
The yield curve is the main indicator pointing towards a recession:

The various longer-term/one-year spreads (right chart) have been inverted for the majority of 2019. The longer-term/three-month spread inverted in the 2Q19. Both of these have a long and successful history of predicting a recession.
Leading indicator conclusion: there's still a decent amount of bearishness in the above numbers. The year-over-year durable goods numbers are still low and the yield curve is still in a pre-recession orientation.
Coincidental Data
Let's begin with the first report on 2Q18 GDP, which the BEA released on Friday:
Real gross domestic product (GDP) increased at an annual rate of 2.1 percent in the second quarter of 2019 (table 1), according to the "advance" estimate released by the Bureau of Economic Analysis. In the first quarter, real GDP increased 3.1 percent.
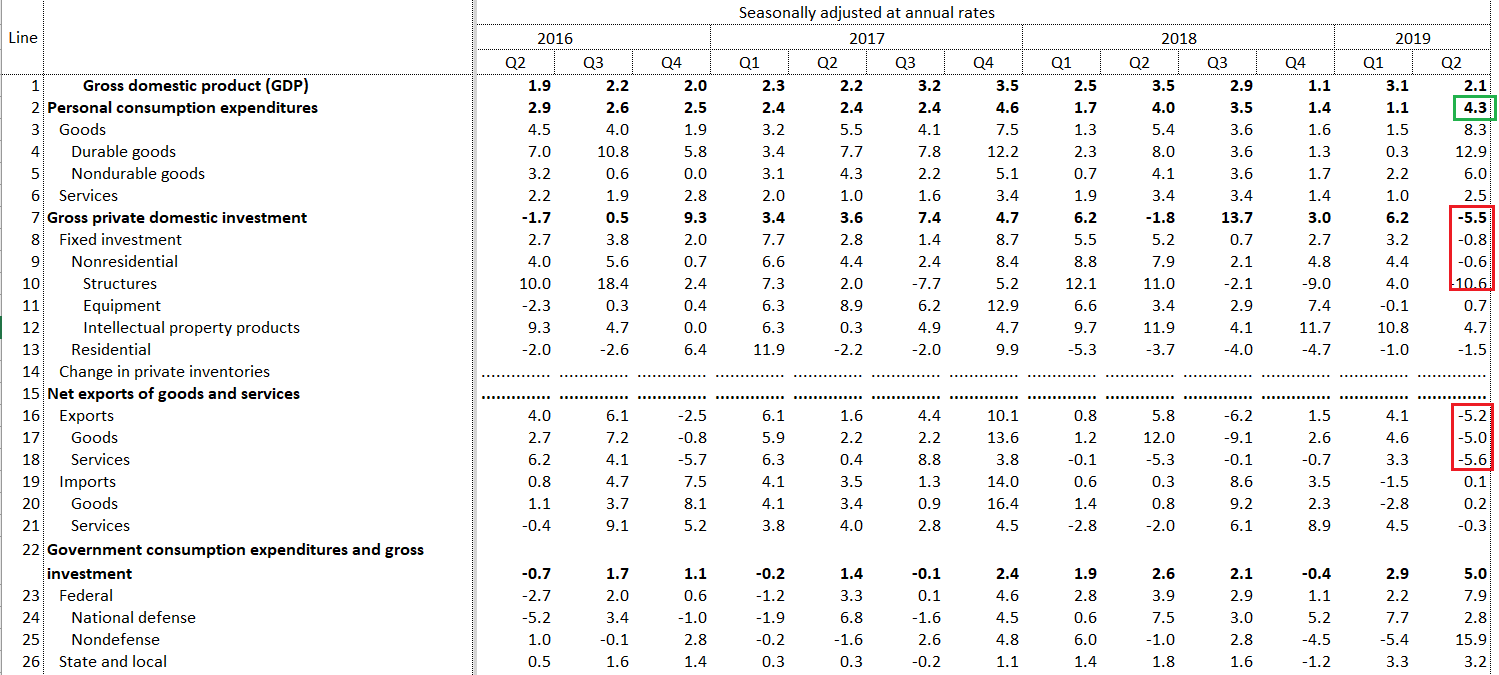
Here's the report's table showing the quarter-over-quarter percentage change:

The market was happy with the report because it wasn't as bad as feared. But the internals aren't that encouraging. The main piece of good news was the large increase in PCEs, which rose 4.5% from the preceding quarter. And the 12.9% jump in durables spending was certainly welcome. But domestic investment dropped 5.5% thanks to very weak corporate activity: non-residential investment declined 10.6% and equipment spending rose a very modest .7%. The trade wars are clearly biting: exports declined 5.2% and imports were up the smallest increment possible - 0.1%. If it wasn't for the 5% increase in government spending, growth would have been below 2%.
Coincidental numbers conclusion: For the second quarter in a row, the internals of the GDP report pointed towards weakness that belies the headline number. This isn't a fatal development, but it does raise additional questions about the strength of US growth.
