Summary- Corporate earnings are still growing.
- Despite the more dovish Fed, the yield curve is still supporting a 25% recession probability in the next 12-18 months.
- The employment report was very strong.
The purpose of the Turning Points Newsletter is to analyze the long-leading, leading, and coincidental indicators to determine if the economic trajectory has changed from expansion to contraction - to determine if the economy has reached a "Turning Point."
Before diving into the data, let me explain my methodology. I don't have a model like the Conference Board's that assembles indicators into a single number. I dislike this approach because it assumes all indicators always have the same weight for every economic scenario. Instead, I look at the data and come up with a percentage based on the sum/total of all information. I do check in on the NY and Cleveland Feds' yield curve recession probability analysis to make sure I'm in the same ballpark.
I mention this because I've predicted a 25% probability of a recession in the next 12-18 months. This is primarily based on the flattening of the yield curve and the small inversions we've seen in the belly of the curve in January. But does this still hold-up with a Fed that is now "patient" in the face of incoming data? The answer is yes. The Fed just switched from a tightening to neutral bias. Additionally, it takes 6-12 months for rate hikes to move through the economy, meaning the Fed's rate increases from last year are still slowing growth in some capacity.
Put in more direct terms, I still have 25% recession probability in the next 12-18 months.
That being said, let's look at the data.
Long-Leading Indicators
Let's take a look at the latest earnings data from Wall Street, starting with Zacks (emphasis added):
Total earnings for the 136 S&P S&P 500 index members that have reported results already are up +12.6% from the same period last year on +5.9% higher revenues, with 69.1% beating EPS estimates and 60.3% beating revenue estimates.
This is a notably weaker showing than we have seen from the same group of 136 index members in other recent periods.
From FactSet:
The blended (combines actual results for companies that have reported and estimated results for companies that have yet to report), year-over-year earnings growth rate for the fourth quarter is 12.4% today, which is above the earnings growth rate of 10.9% last week.
The blended, year-over-year revenue growth rate for the fourth quarter is 6.6% today, which is above the revenue growth rate of 6.2% last week.
The good news is that revenues and earnings are still increasing. The less-than-good news is that the growth pace is slowing. This isn't fatal, but it does add to the idea that the economy is slowing overall.
Leading Indicators
Let's begin with two pieces of good data:
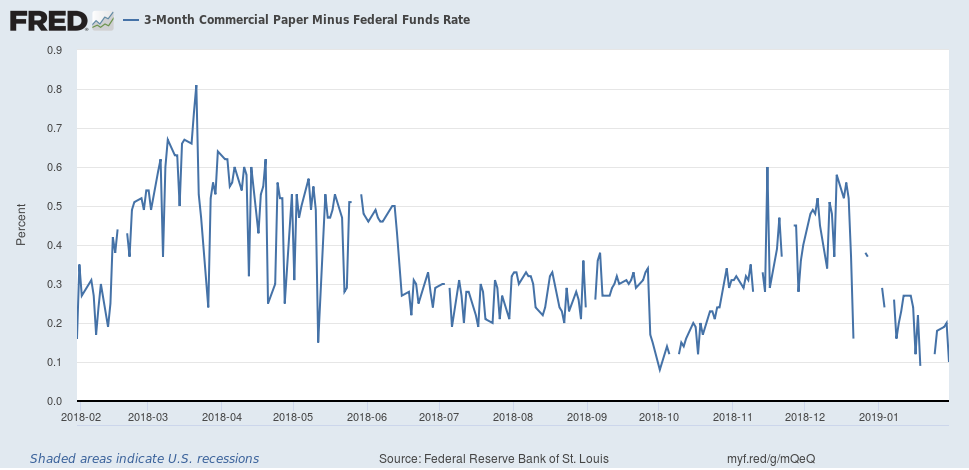
The commercial paper Fed Funds spread has dropped from the .55-.7 level back to the .1-.2 level.
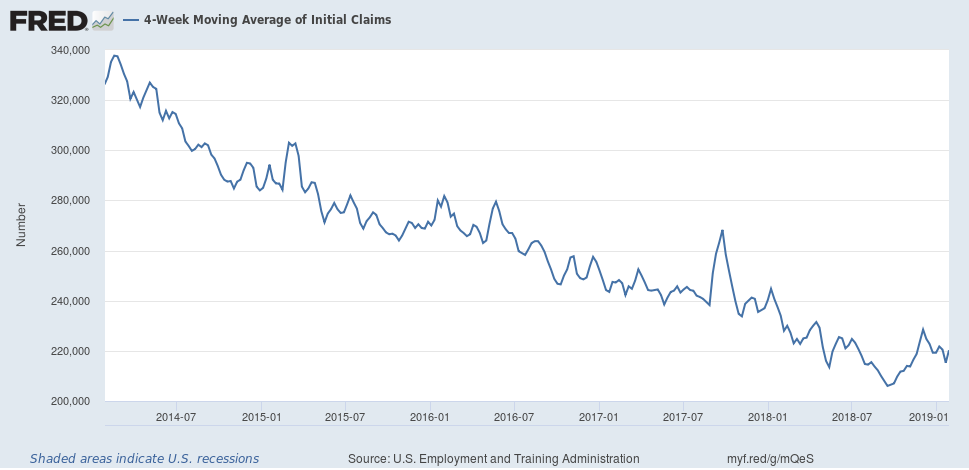
The four-week moving average of initial unemployment claims is still at very low levels and, despite a move higher at the end of last year, continues its downward trend.
However, the primary issue of a flattening yield curve remains. Just to refresh everybody's memory, towards the end of an expansion, the Fed starts to raise interest rates to either preempt inflation's rise or to slow an already rising inflation rate. The long-end of the curve rises for a time during the initial rate increases. But at some point, bond traders start to believe that the Fed's rate increases will slow growth, which will slow inflation, which makes the long-end of the curve more attractive. Therefore, traders start to buy long-bonds, which lowers yields.
That process is already underway:
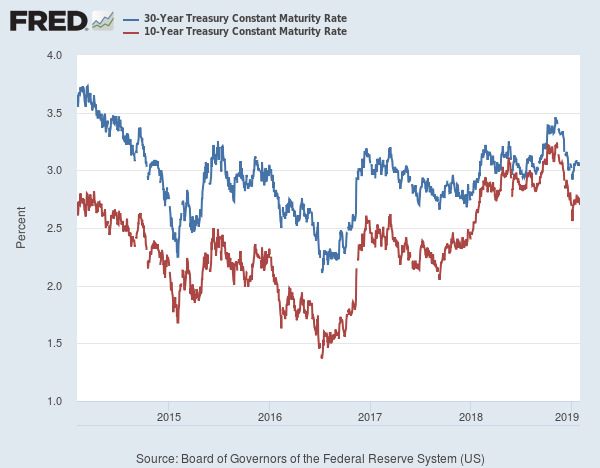
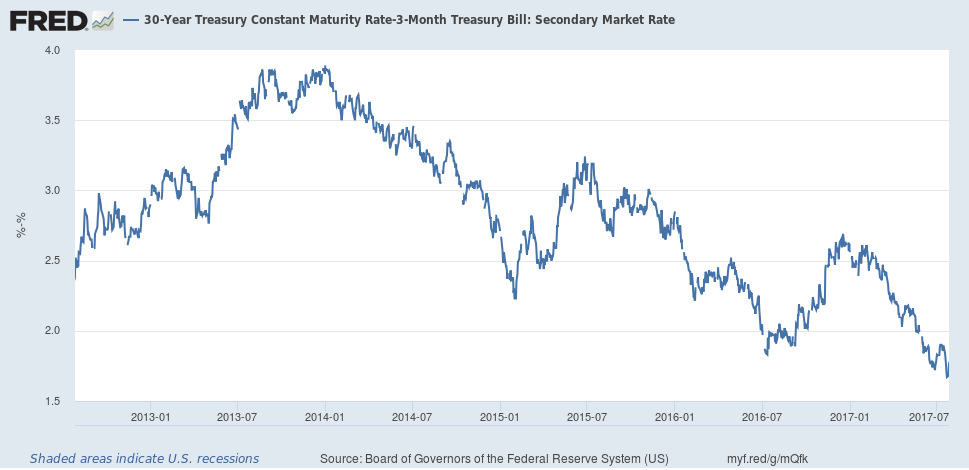
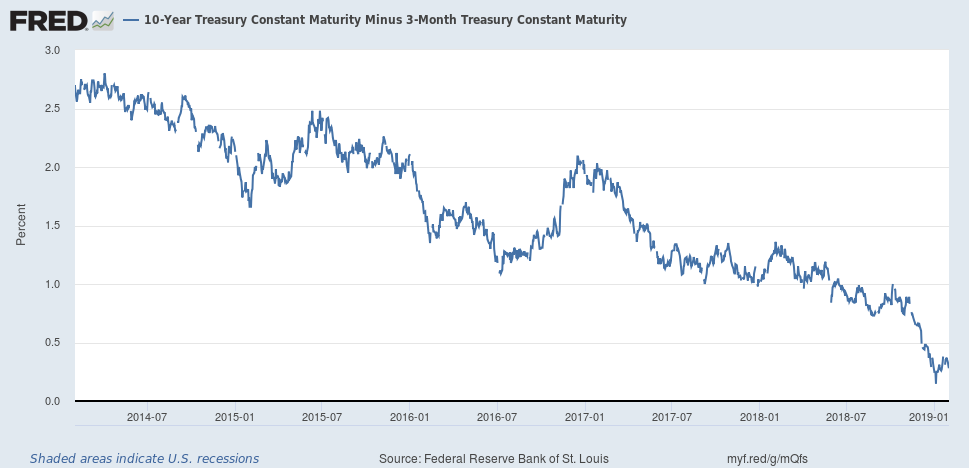
The long-end of the curve has come in over the last few months as bond traders have started to bet that growth will slow. This has led to a flattening yield curve:
The 30-year-3-month rate continues to contract...
...as does the 10-year-3-month spread.
The bond market moves slowly and deliberately. A change in Fed policy won't have an immediate impact, especially after the Fed has been raising rates for a few years. The bond market's overall flattening trend would have to reverse strongly, convincingly, and over a longer period of time to radically change the recession odds.
Coincidental Indicators
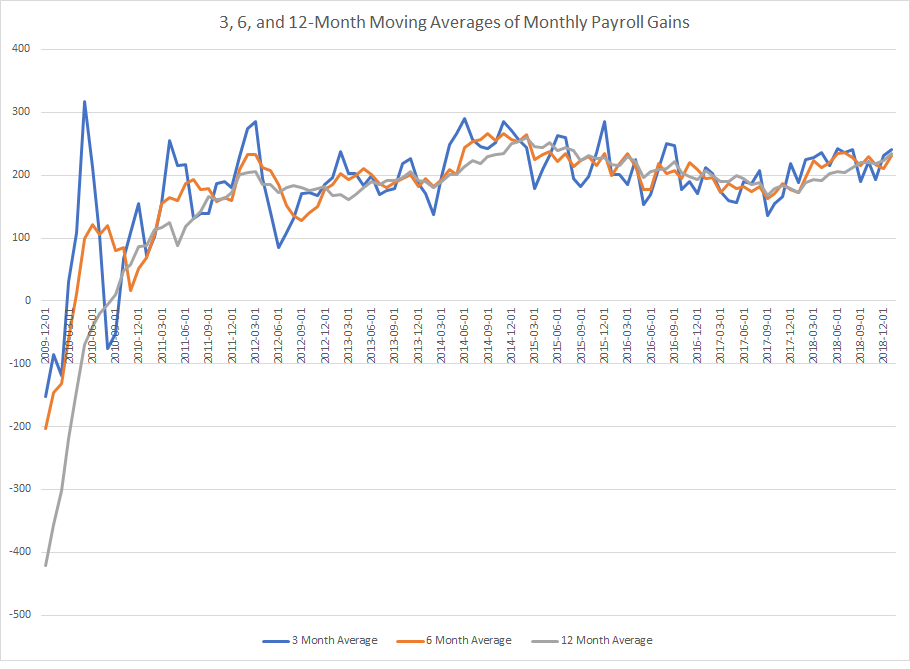
This week's big news was Friday's blowout employment report, which was surprisingly strong considering the expansion's age. To remove the statistical noise, I use 3-, 6-, and 12-month moving averages of monthly establishment gains, which are shown in the following chart:
All three are over 200,000/month.
Conclusion: Right now, the contracting yield curve is the main data point supporting increased recession odds in the next 12-18 months. This won't change unless there is a meaningful reversal of the flattening trend. The good news is that the labor market - which is probably the most important coincidental indicator - is still very strong.
Disclosure: I/we have no positions in any stocks mentioned, and no plans to initiate any positions within the next 72 hours. I wrote this article myself, and it expresses my own opinions. I am not receiving compensation for it (other than from Seeking Alpha). I have no business relationship with any company whose stock is mentioned in this article.

