Summary
- Corporate profits for the S&P 500 are still looking positive.
- New orders for consumer goods took a sharp drop in the latest report; the yield curve continues to act in an end-of-the-cycle manner.
- I've still got a 25% recession probability for the next 6-12 months.
The purpose of the Turning Points Newsletter is to look at the long-leading, leading, and coincidental economic indicators to determine if the economic trajectory has changed from expansion to contraction - to determine if the economy has reached a "Turning Point."
Long-Leading Indicators
Let's check-in on corporate earnings. From Zacks (emphasis added):
As expected, Q4 earnings and revenue growth is tracking notably below what we had seen from the same group of 282 index members in other recent periods, but the proportion of these companies beating estimates, particularly EPS estimates, is the lowest in more than three years.
Looking at Q4 as a whole, combining the actual results that have come out with estimates for the still-to-come companies, total earnings for the S&P 500 index are expected to be up +13.3% from the same period last year on +6.1% higher revenues.
Going into this earnings season, we knew that comparisons would be difficult, thanks to the distorting effects of the tax cuts that went into effect in 1Q17. Companies are also dealing with macro-level problems: a global decline in trade, a slowdown in China and the EU, Brexit-created uncertainty, and the high level of trade tensions. Still, earnings and revenue are increasing, which will provide companies the fuel to increase their labor force and make capital investments.
Leading Indicators
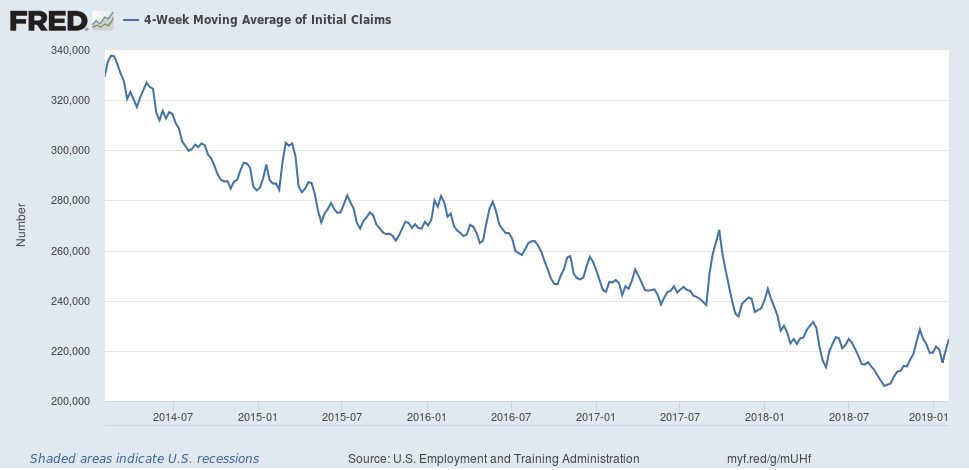
The one-year chart of the four-week moving average of initial unemployment claims is still positive:
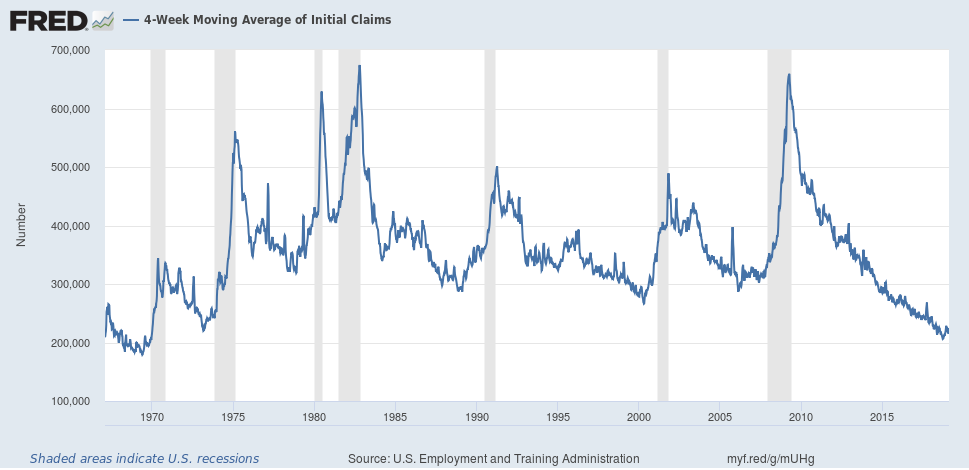
However, earlier this week, the Bespoke investment Twitter feed noted that this metric hasn't hit a new low for 21 weeks. There are two ways to analyze that statement. The first is that claims are already at such low levels that they can't go much lower. But their observation is well-taken: this data point usually turns convincingly higher before most recessions:
We can place that data into a broader economic context by noting that news from automakers has been bearish, which I noted in Thursday's Technically Speaking:
Second, these industries not only employ large numbers of people but also stand at the epicenter of numerous supply chains. When the big companies' sales slow, it sends negative ripple effects into the economy at large.
The combination of weak auto news and the fact that this data series is near its expansion low means we should keep an eye for modest yet continued increases.
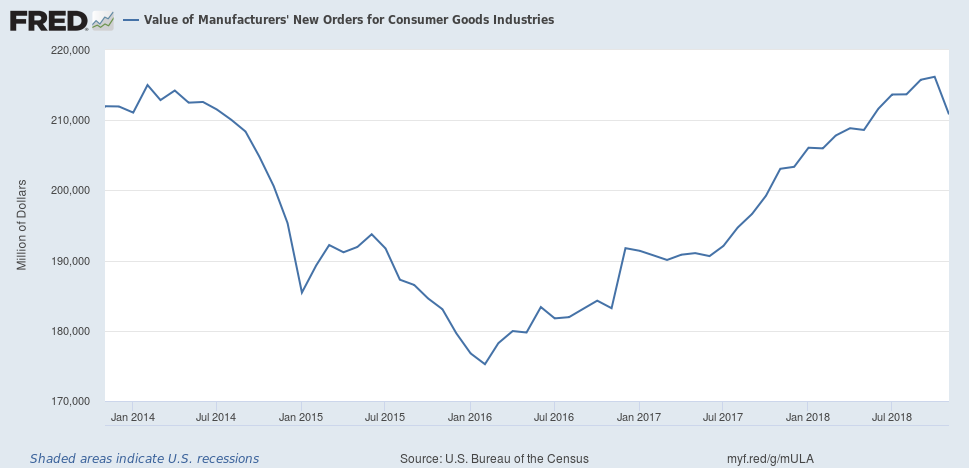
This week, the Census Bureau released the latest durable goods report, which contained a 2.5% decline in consumer goods orders:
The Y/Y number (+95) is still strong. But this release contains data from October-November, which means we haven't seen the negative impact of the government shutdown or sharp drop in consumers' future expectations in this data. All these factors lead me to give this release a modest yellow flag.
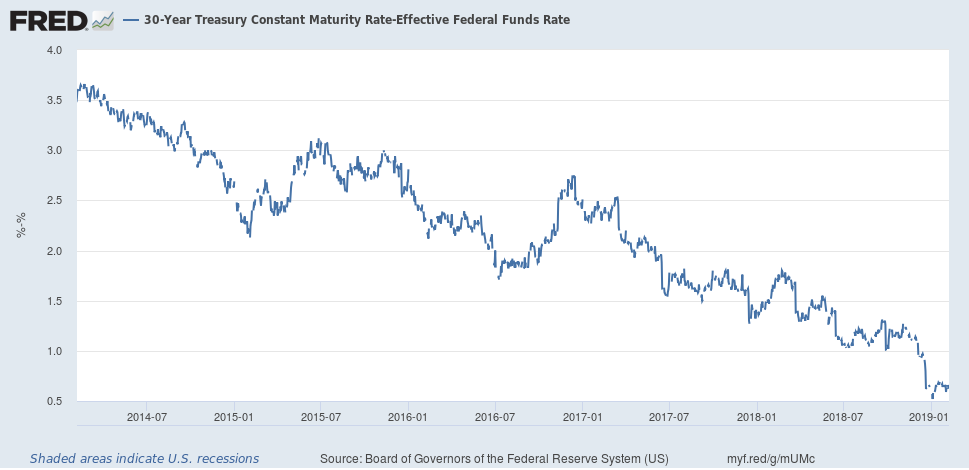
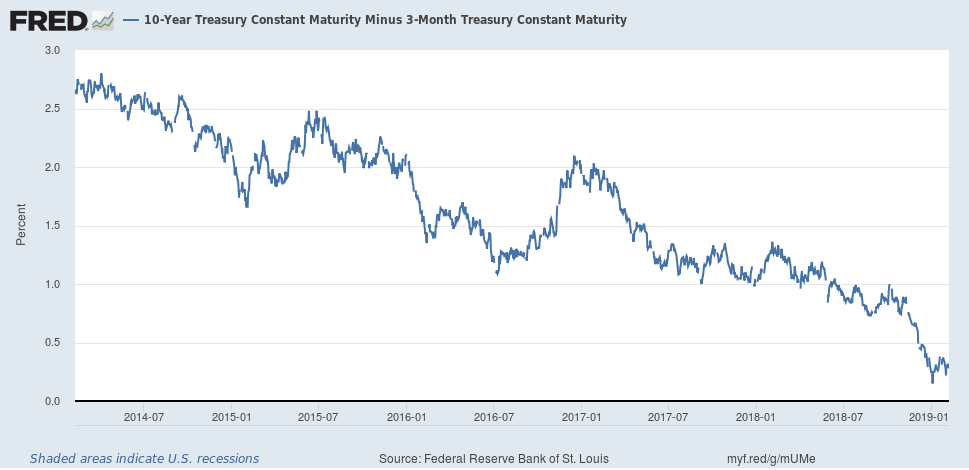
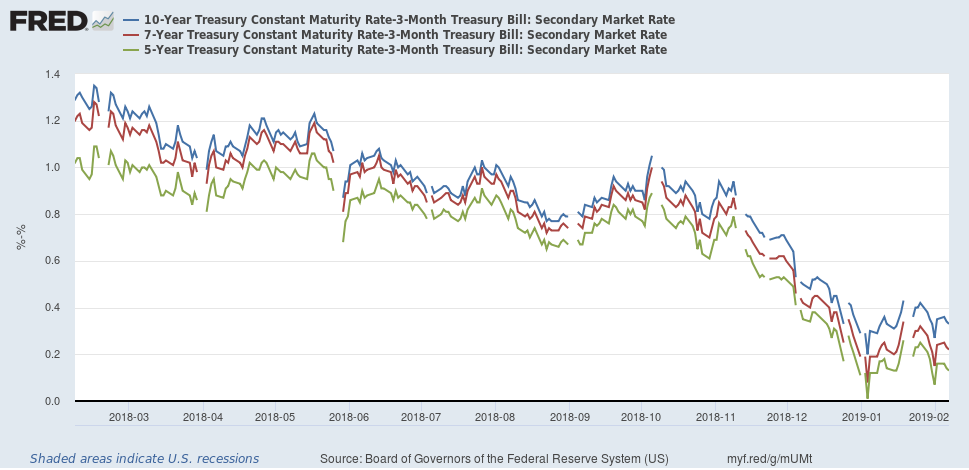
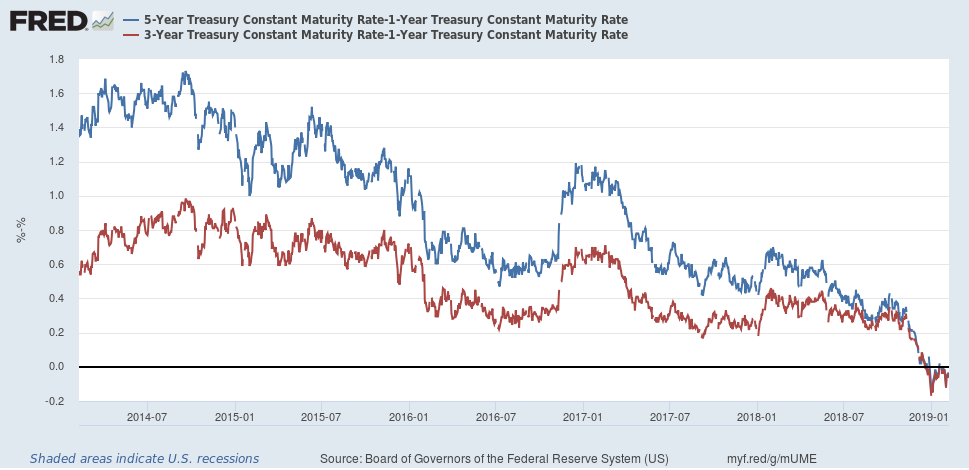
As I noted last week, most of the reason for my concern about the next 6-12 months is based on the yield curve, which continues to behave in a standard, end-of-cycle manner. None of that has changed.
The 30-year Fed Funds rate is right above 50 basis points.
And the 10-year-3-month is below 50 basis points.
The overall spreads in the belly of the curve remain at very tight levels.
And the 5-year-1-year and the 3-year-1-year spreads have both gone negative since the first of the year.
I've seen a fair amount of commentary that because of the Fed's extraordinary actions, the yield curve is no longer a viable predictor of economic activity. To my ears, this sounds remarkably like the "this time is different" crowd from the housing bust years. Until the yield curve is no longer viable as an indicator, I'll keep assuming it is.
Disclosure: I/we have no positions in any stocks mentioned, and no plans to initiate any positions within the next 72 hours. I wrote this article myself, and it expresses my own opinions. I am not receiving compensation for it (other than from Seeking Alpha). I have no business relationship with any company whose stock is mentioned in this article.

