Summary
- The credit markets continue to tighten.
- The stock market sell-off continues.
- Housing continues to soften.
The purpose of the Turning Points Newsletter is to look at the long-leading, leading, and coincidental economic indicators to determine if the economic trajectory has changed from expansion to contraction - to see if we've reached an economic turning point.
Let's begin with the credit markets, starting with the short end of the corporate market:
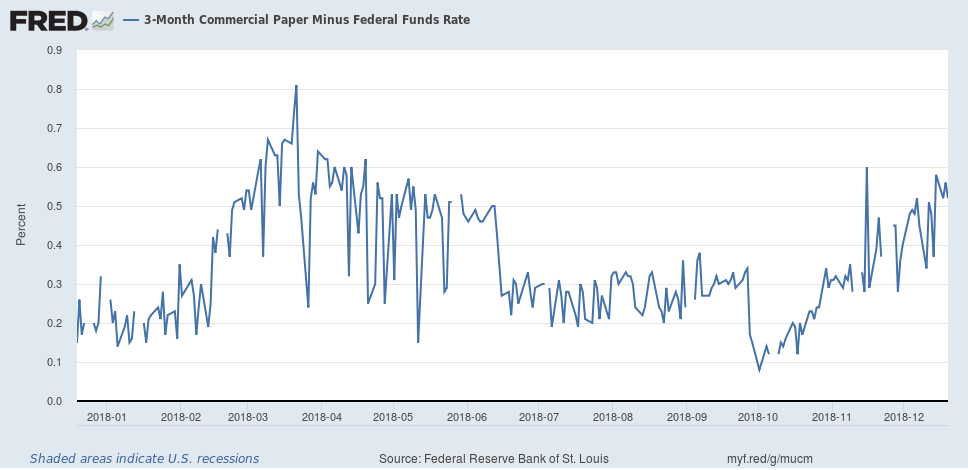
Once again, commercial paper is rising relative to the FF rate. It's back at levels we saw in mid-2018. This is a net negative.
Other segments of the corporate market are widening:
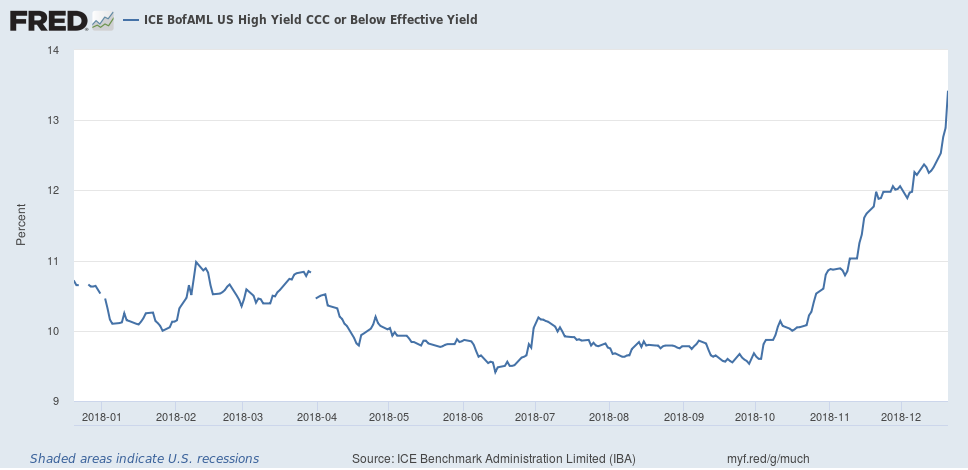
CCCs continue to move higher at a sharp rate. The pace shouldn't be surprising; this part of the bond market usually trades a bit more like equities than bonds.
The top chart shows that absolute Baa yields are coming in a bit, which is positive. But relative to the 10-Year, this segment of the corporate market is widening.
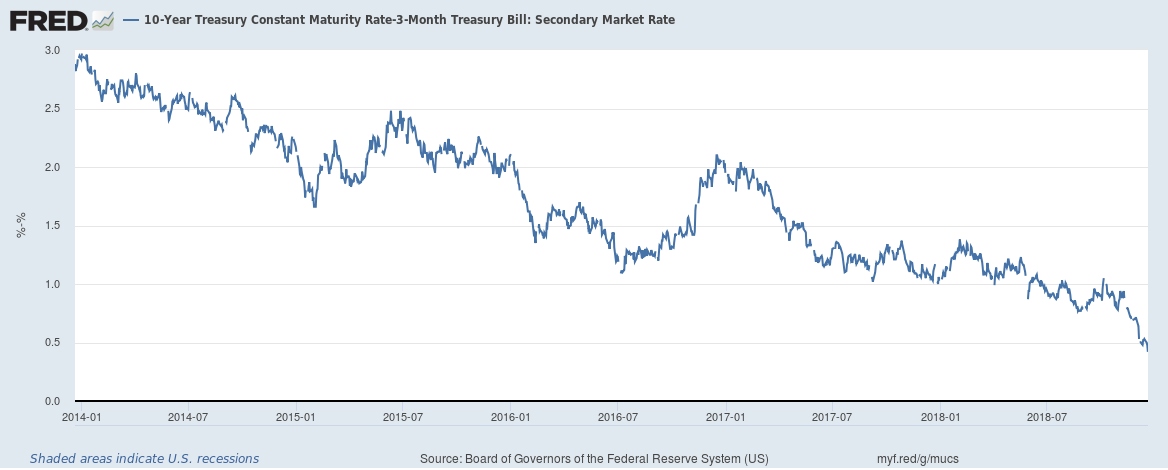
And the Treasury curve continues to narrow:
As for other financial markets, the S&P 500 continues to correct:
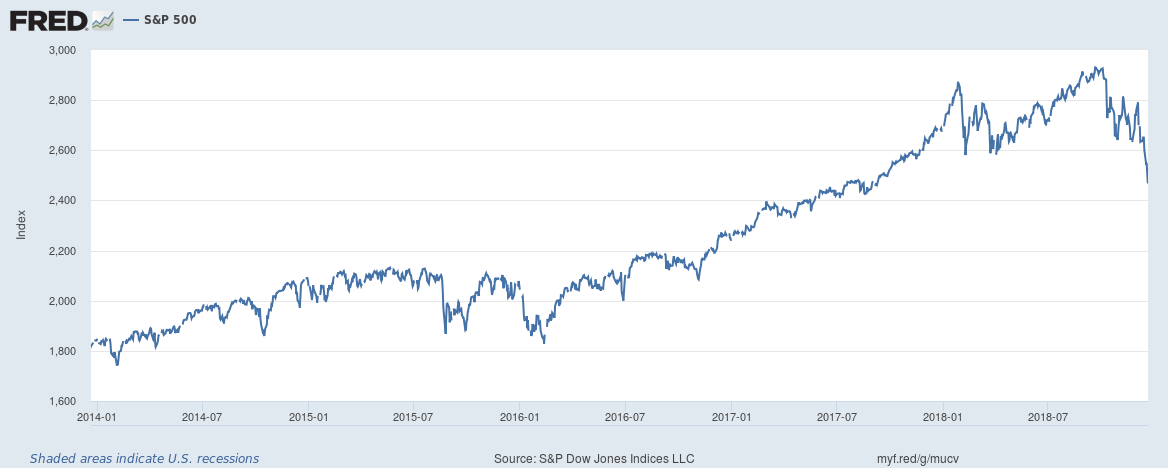
The sum/total of the financial markets is bearish. Riskier segments of the corporate market continue to widen. Baa's are higher relative to the Treasury market. Commercial paper is widening as well. And the S&P 500 is in a clear correction.
This week, we received new data on two other leading indicators: durable goods and building permits. Let's start with the former. The headline number was a positive .8% M/M gain. But the ex-transport number was -.3% - the second decline in three months. This number has been right at the 164,000/month level for most of this year.
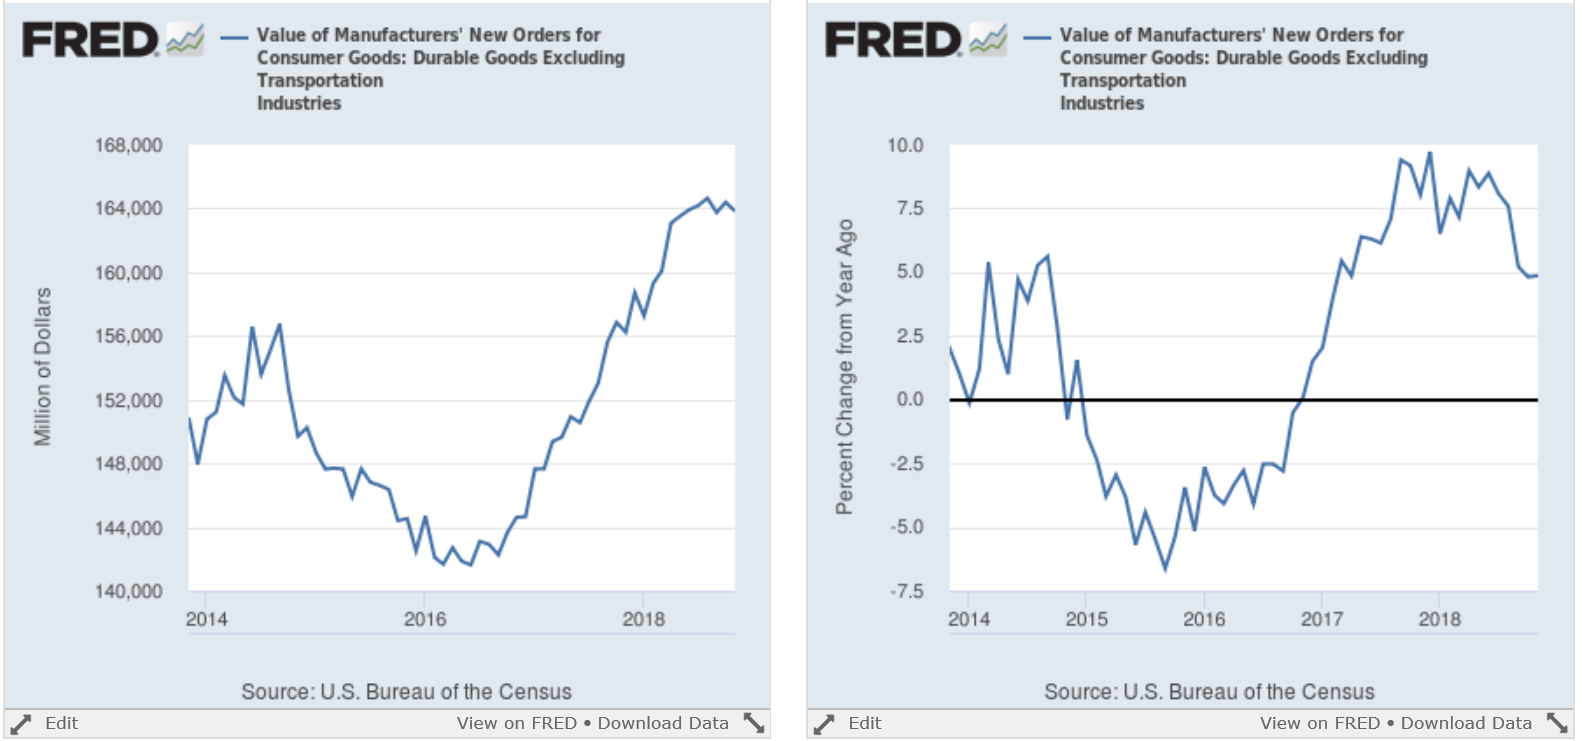
The Y/Y pace (right-hand chart) is declining, but it's still at a healthy 5%. Two other key sub-categories of data are also positive:
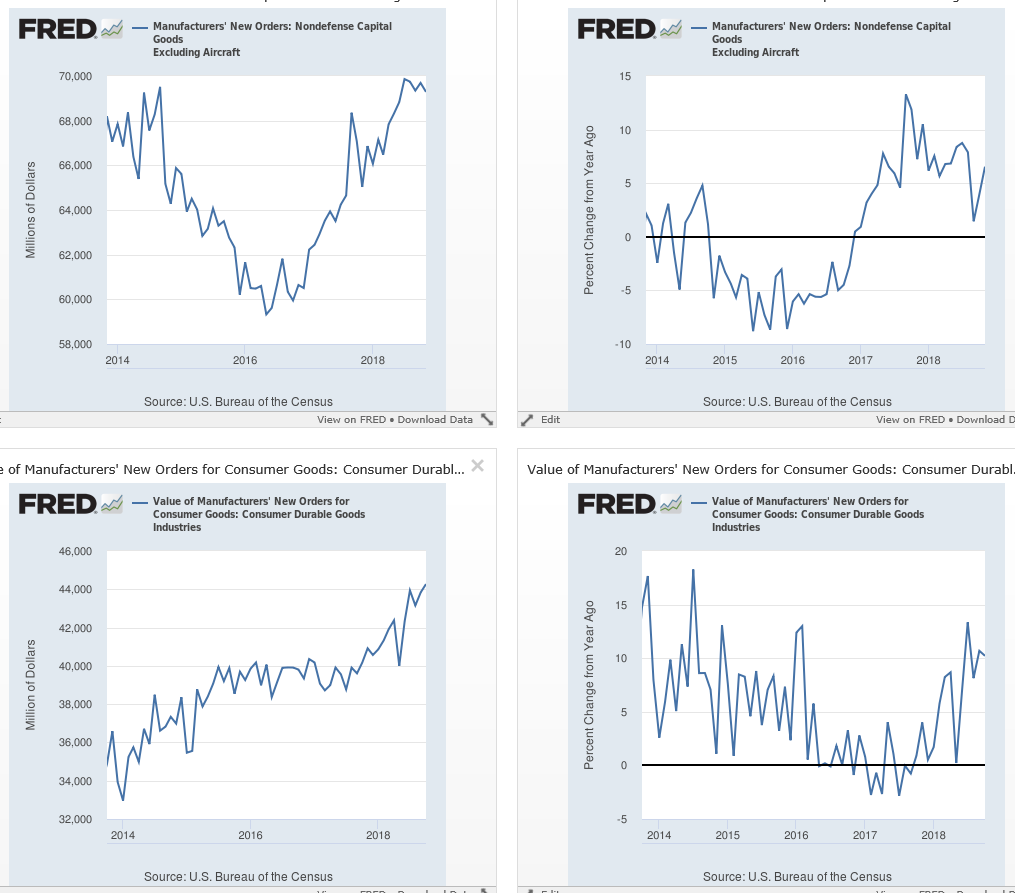
The top two charts show non-defense capital goods ex-aircraft. The absolute number (left) has probably peaked this cycle; it's been just south of 70,000/month for the latter half of 2018. The right chart shows that the Y/Y pace is declining, but is still at a solid 5% plus. The bottom two charts show the same data for durable consumer goods orders, which are at a 5-year absolute high in the latest report. The Y/Y pace is right around 10%.
These numbers are in line with the latest ISM PMI, which has been printing in the upper-50s/lower-60s for the last 12 months. Overall, manufacturing is in good shape.
Housing, however, continues to soften (emphasis added):
Privately‐owned housing units authorized by building permits in November were at a seasonally adjusted annual rate of 1,328,000. This is 5.0 percent (±1.6 percent) above the revised October rate of 1,265,000 and is 0.4 percent (±1.7 percent)* above the November 2017 rate of 1,323,000. Single‐family authorizations in November were at a rate of 848,000; this is 0.1 percent (±1.4 percent)* above the revised October figure of 847,000. Authorizations of units in buildings with five units or more were at a rate of 441,000 in November
Let's start with the overall number:
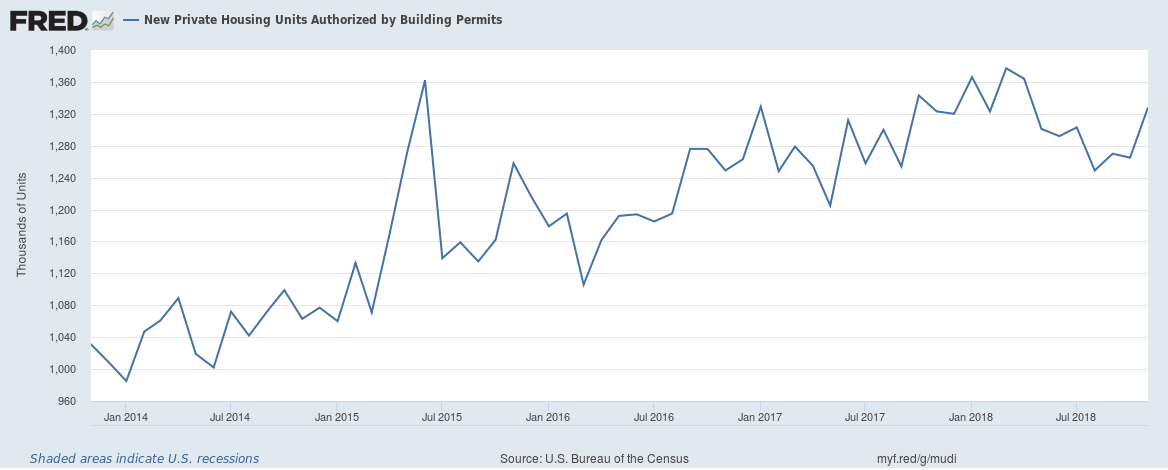
This number had been trending lower for most of the year. The latest reading was goosed higher by a huge increase (15%) in apartment permits in the South. The 5-unit number had been trending lower for the last 11 months, which means this increase is probably a one-off number.
Apartments are important, but individual houses are more relevant to the economic cycle. Here is a chart of the data:
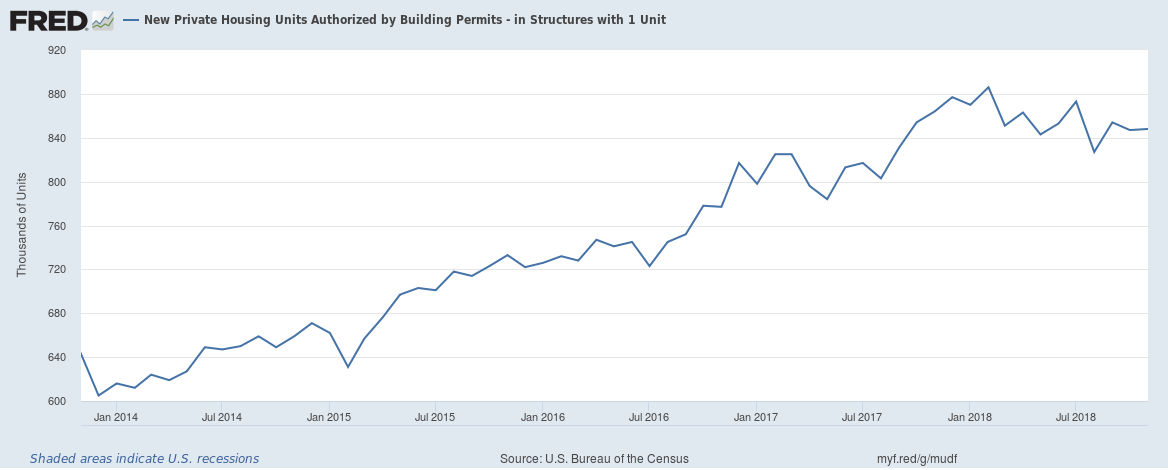
They haven't cratered by any stretch of the imagination. But the pace is clearly slowing.
I'm holding my recession probability in the next 18-24 months at 30%. The credit markets are now in a classic pre-recession orientation. Lower-rate paper is selling off; commercial paper spreads are widening; and the yield curve continues to flatten. The stock market sell-off is sharp. Housing is softening. These are all signs of a potential recession. It's not imminent, but there's a more than small possibility it could happen.
Disclosure: I/we have no positions in any stocks mentioned, and no plans to initiate any positions within the next 72 hours. I wrote this article myself, and it expresses my own opinions. I am not receiving compensation for it (other than from Seeking Alpha). I have no business relationship with any company whose stock is mentioned in this article.
