Turning Points For The Week Of April 29-May 2
Summary
- While lower, corporate revenue growth is still positive.
- The leading indicators -- save for the yield curve -- are improving.
- The jobs market is very strong.
The purpose of the Turning Points Newsletter is to look at the long-leading, leading, and coincidental economic indicators to determine if the economic trajectory has changed from expansion to contraction - to see if the economy has reached a "Turning Point."
Conclusion: I'm lowering my recession probability in the next 6-12 months to 15%. Corporate profits continue to grow. While there's some softness in the leading indicators, this should be contained due to rising business sentiment and a more dovish Fed. The only leading indicator that is still giving a meaningful recession signal is the yield curve. Current indicators are very strong, as evidenced by the latest employment report.
Long Leading Indicators
Corporate Profits
From Factset (emphasis added):
For the first quarter, the S&P 500 is reporting a year-over-year decline in earnings of 2.3%, but year-over-year growth in revenues of 5.1%.
Total earnings for the 313 S&P 500 members that have reported results already are up 0.1% on +3.8% higher revenues, with 78.0% beating EPS estimates and 61.0% beating revenue estimates.
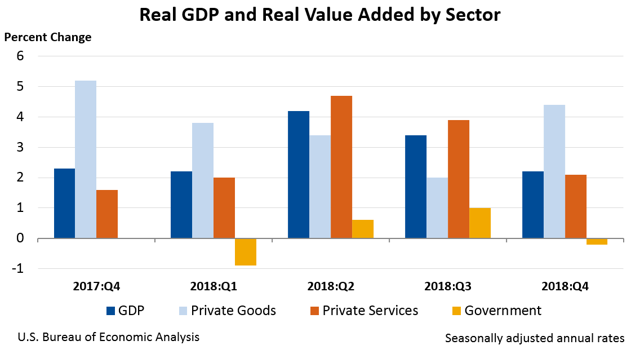
Finally, here's the macro-level data from the BEA's latest report:
Remember that the BEA data is for the economy as a whole, not just the 500 companies comprising the SPY.
The SPY company data tells us that margins are getting squeezed, which means future spending might be threatened. The BEA data tell us that revenue growth is not restricted to larger, publicly traded companies. Overall, the business climate is still positive.
Leading Indicators
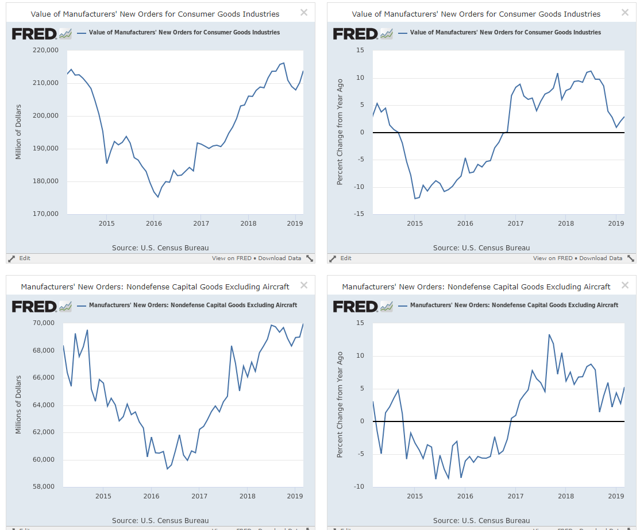
Let's start with key orders numbers:
Orders for consumer durable goods (left chart) are back on the rise, which is evidenced in the Y/Y numbers (right chart). Non-defense capital goods excluding aircraft (bottom left) are back near 5-year highs. The Y/Y percentage change (right) is advancing.
The softness in these numbers during 1Q19 was a concern. It now appears to be over.
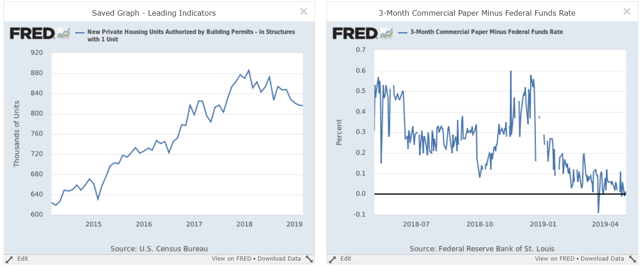
1-unit building permits (left chart), while declining, are still at high levels. This number should stabilize thanks to rising homebuilder sentiment and lower interest rates. Commercial paper yields (right) are at very low levels, indicating there is little to no stress in the short-term funding markets.
The S&P 500 is back near record highs.
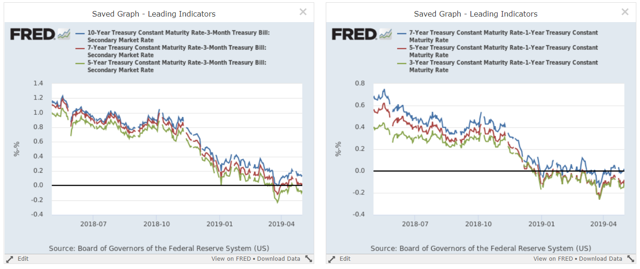
The yield curve is still very narrow:
The belly of the curve is tight. The 10/7/5-year-3 month spreads (left chart) are low. The 7/5/3-year-1-year spread remains modestly underwater.
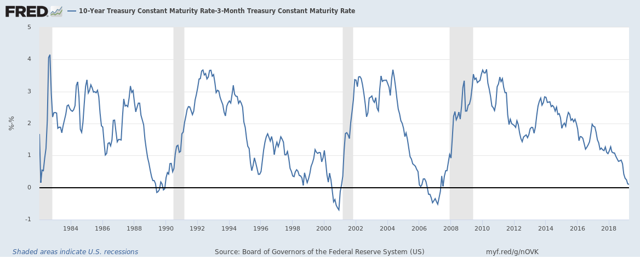
A longer-term look at the 10-Year-3-Month spread indicates the economy could still be close to a recession:
Of the leading indicators, only the yield curve is still giving a recessionary signal.
Leading indicators conclusion: these numbers are in better shape. Durable orders are up along with financial markets. Lower mortgage rates and a more dovish Fed should support the housing market.
Coincidental Economic Indicators
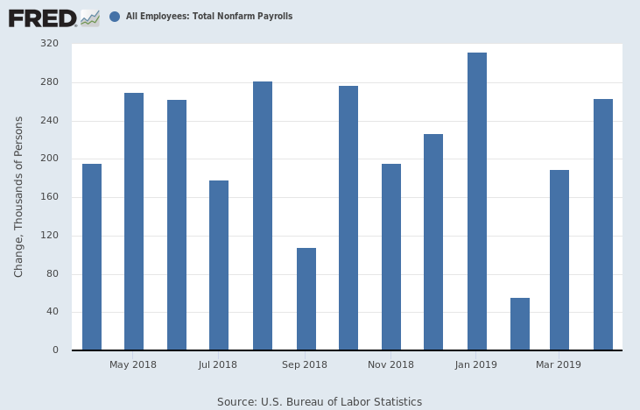
Two months ago, the BLS reported very weak job growth:
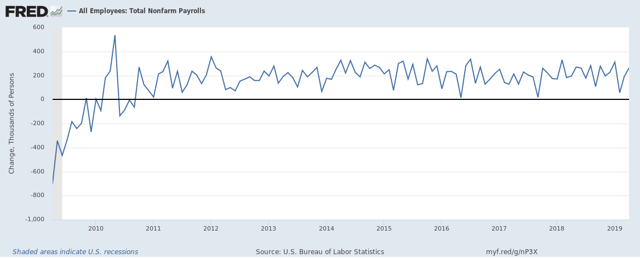
This occurred while other economic data was weakening, which lead to increased concern about the state of the economy. That drop now appears to be a short-term aberration, much like the other 1-month dips seen in the following chart:
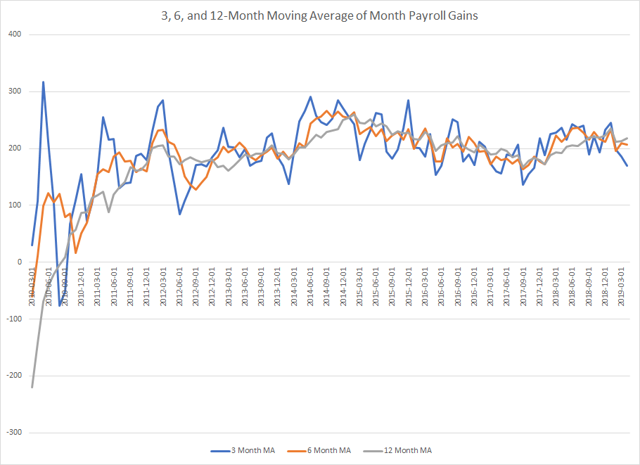
The 3, 6, and 12-month averages of total establishment job growth are also at solid levels:
Data from the St. Louis Fed; author's calculations
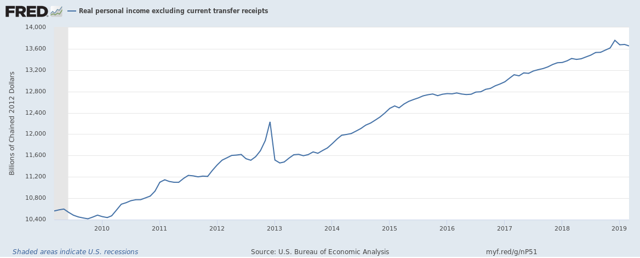
Finally, personal income excluding transfer payments has been moving sideways for the last few months:
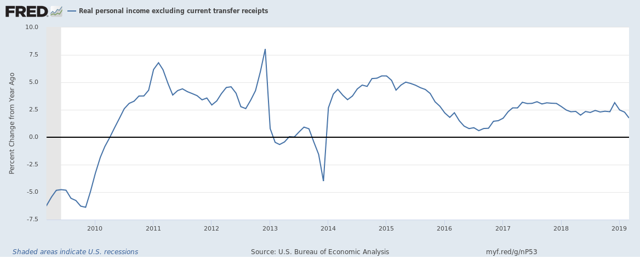
But the Y/Y percentage change is still at high levels:
Coincidental numbers conclusion: The jobs market has rebounded from early year weakness and is now printing solid jobs gains. Income growth is modestly weaker but is not at devastatingly low levels.
Disclosure: I/we have no positions in any stocks mentioned, and no plans to initiate any positions within the next 72 hours. I wrote this article myself, and it expresses my own opinions. I am not receiving compensation for it (other than from Seeking Alpha). I have no business relationship with any company whose stock is mentioned in this article.

