Summary
- Corporate earnings are under pressure.
- The yield curve is still inverted; weekly manufacturing hours worked continued to decline, indicating additional jobs-market weakness.
- The pace of monthly job creation is slowing.
The purpose of the Turning Points Newsletter is to look at the long-leading, leading, and coincidental indicators to determine if the U.S.' economic trajectory has changed from expansion to contraction -- to see if the economy has reached an economic "Turning Point."
Conclusion: My recession probability for the next six to 12 months remains at 20%. Corporate earnings are down, which will continue to depress corporate sentiment. The yield curve continues to invert and the pace of job creation is starting to slow. The sharp decline in the six-month moving average of monthly job gains is especially concerning.
Long-Leading Indicators
Let's start with corporate earnings, starting with FactSet (emphasis added):
The blended revenue growth rate for the second quarter is 4.1% today, which is above the revenue growth rate of 3.9% last week
The blended (combines actual results for companies that have reported and estimated results for companies that have yet to report) earnings decline for the second quarter is -1.0% today, which is smaller than the earnings decline of -2.7% last week.
And Zacks (emphasis added):
Total earnings for the 305 S&P 500 members that have reported Q2 results already are down -3.5% on +4.7% higher revenues
Here's a chart of U.S. economy-side data from the BEA's corporate profits report:
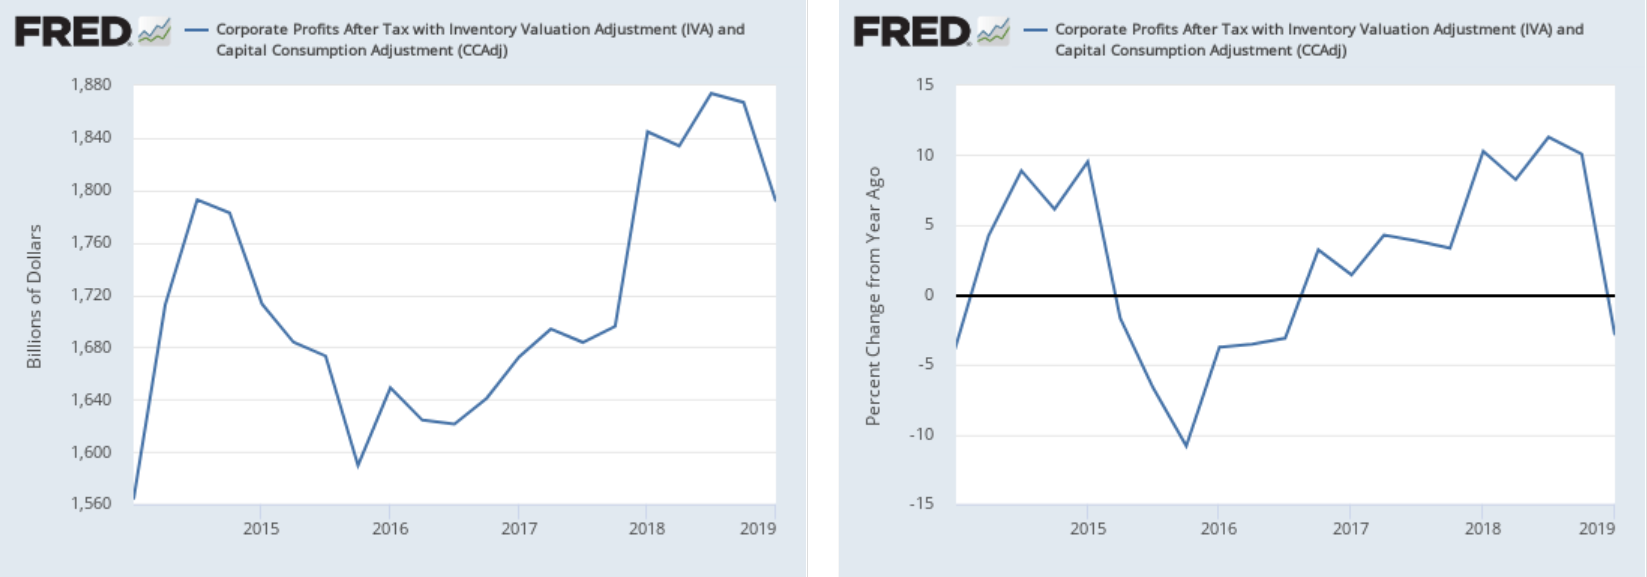
The BEA data covers the widest swath of data.
Higher revenues tell us there is a modest demand increase but the drop in earnings indicates that margins are getting squeezed by costs. We also know from previous FactSet research that revenue growth is mostly domestic-based.
This is a net negative development, as it will lower corporate sentiment, which will lead to a decrease in capital investment (which is already occurring) and weaker hiring (which we may be seeing; see below).
Other long-leading indicators are positive. Corporate interest rates are contained and lower-rated credits are lower as investors reach for yield in a near-0% government interest rate world. M2's year-over-year growth rate has been rising all year.
Leading Indicators
Let's start with new orders for consumer durables:
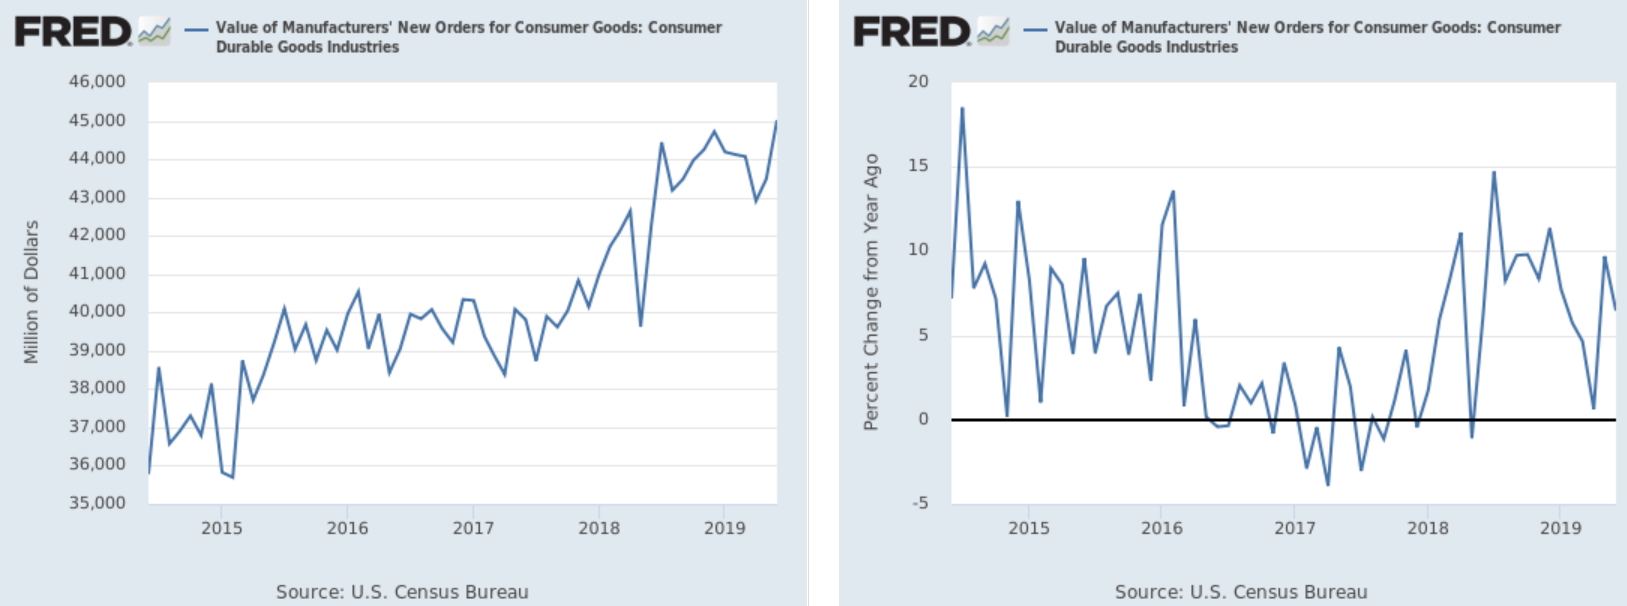
The absolute number of new orders for consumer durables (left chart) is at a five-year high. But this number trended sideways between $43 billion and $45 billion for the better part of a year, indicating stagnation. And it's occurring in a softer consumer durable activity market: The year-over-year increase in durable goods purchases is just below 5%, which is low relative to their five-year range (they had been trending between 5%-7.5%). Auto sales have been trending sideways for several years; furniture purchases are soft in both the PCE and retail sales report. Given the overall softness of the consumer durables market, we need additional data before concluding that the recent upswing is the start of a meaningful new trend or simply a one-to-three-month increase that only replenishes lower inventory levels.
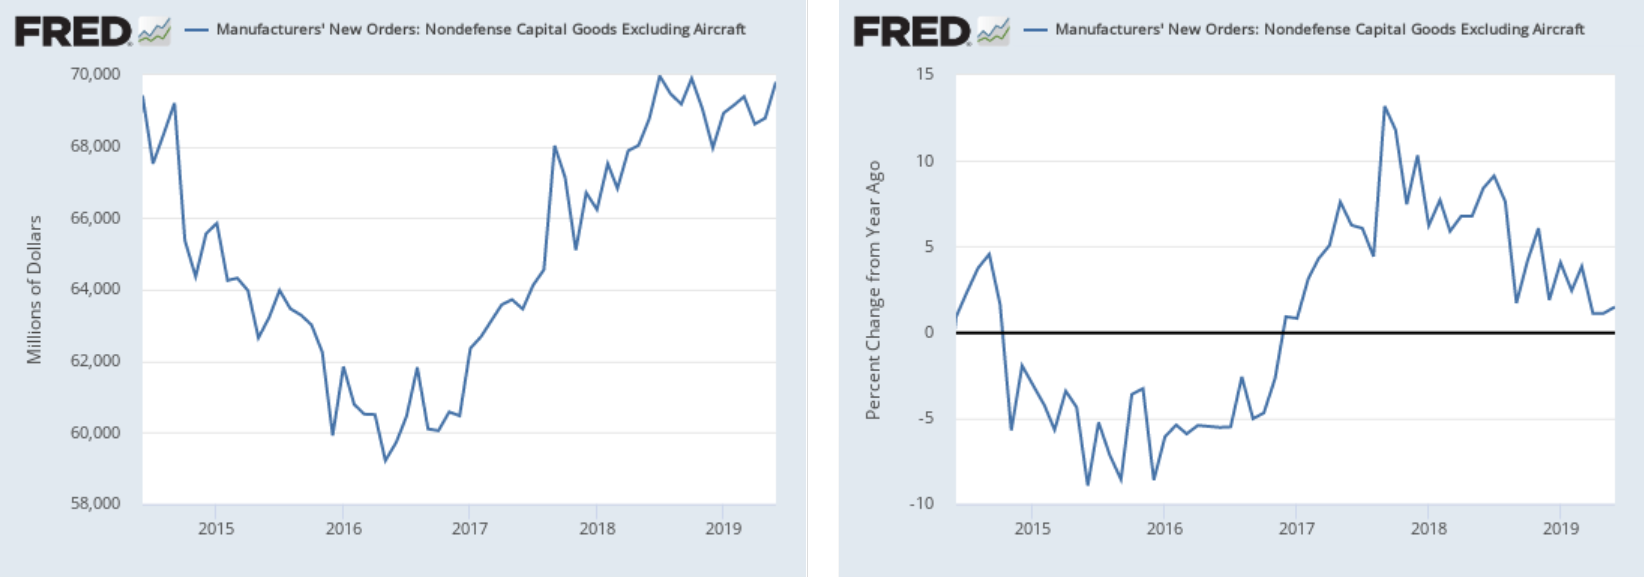
New orders for capital goods (left chart) - like new orders for consumer durables - have trended sideways for nearly a year. The year-over-year growth rate (right chart) is trending lower while also being just above 0%. And, like the consumer durables numbers, this sector is softer: equipment spending is trending lower on a Y/Y basis; industrial production growth has been soft since January.
The employment report contained weaker hours-worked data:
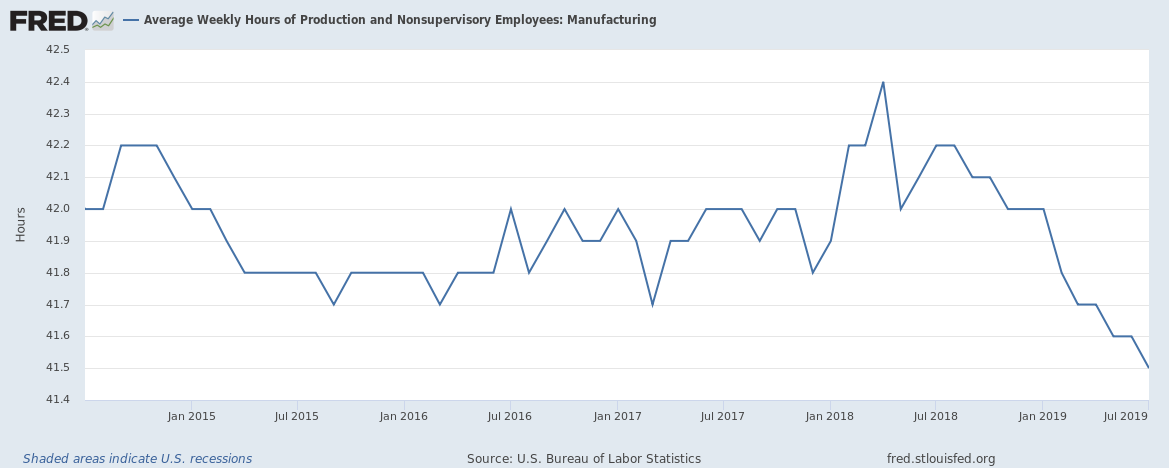
Average weekly hours of production workers have been trending lower for the entire year. This goes hand in hand with the continually softer ISM manufacturing data and softer industrial production numbers.
The yield curve continues to act in a pre-recession manner:
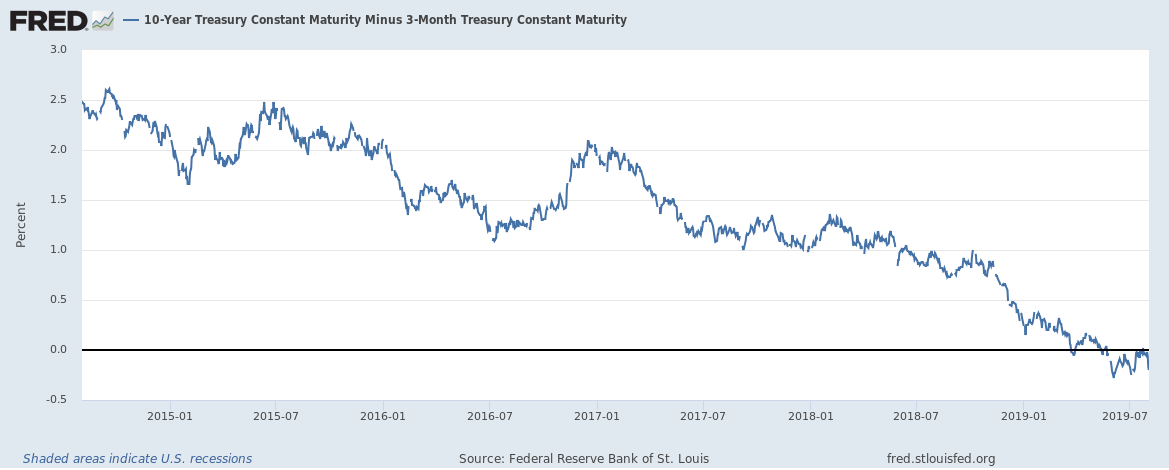
The 10-year/three-month spread has been inverted for the last two months.
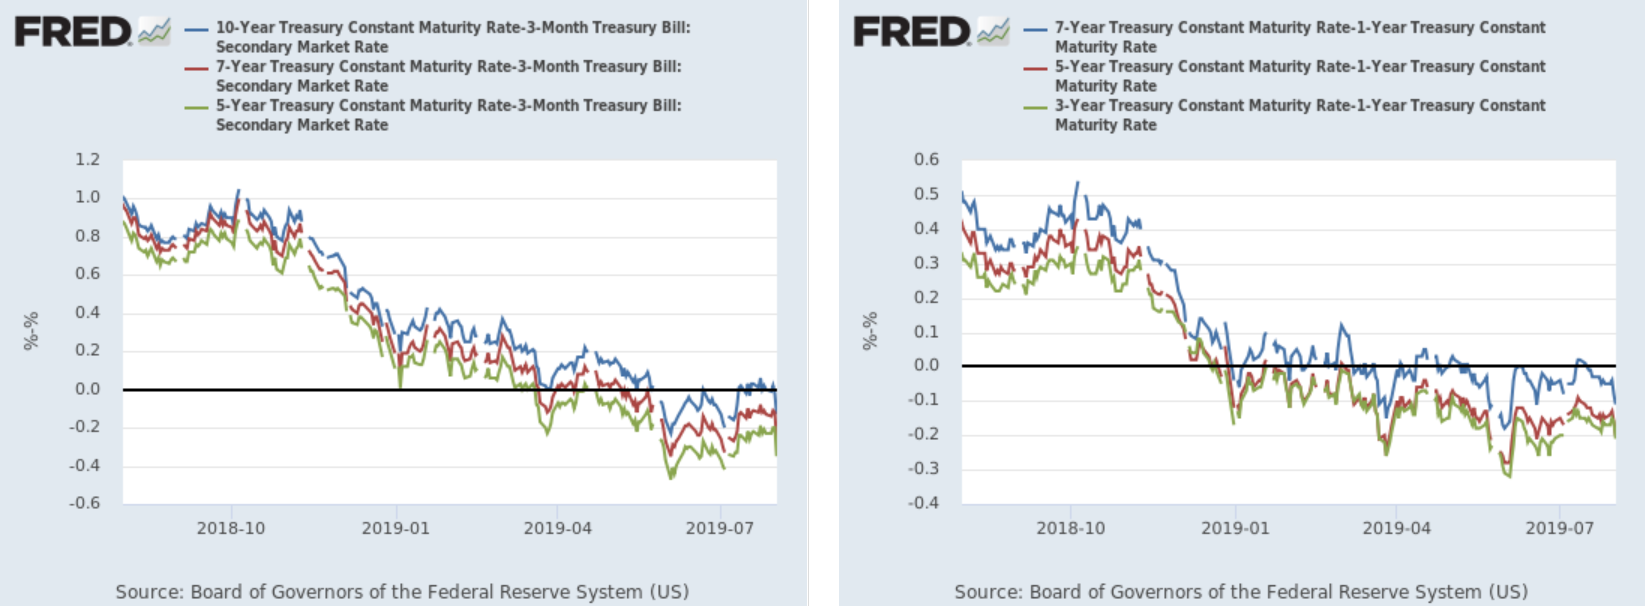
And the belly of the curve has been inverted to varying degrees since the first of the year.
Coincidental Indicators
On Friday, the BLS released the latest employment report. Rather than use the headline monthly number, I use moving averages to strip out some of the monthly noise:
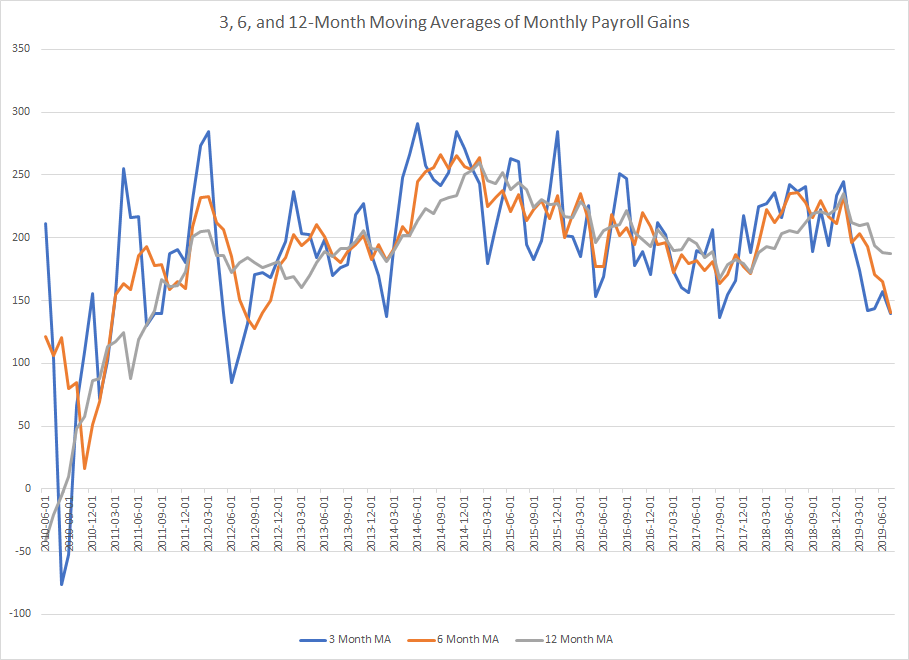
Data from the St. Louis Federal Reserve; author's calculations
The three-month MA (in blue) is near a five-year low. This isn't as concerning as the sharp decline in the six-month number (in gold) which is shown in isolation in the following chart:
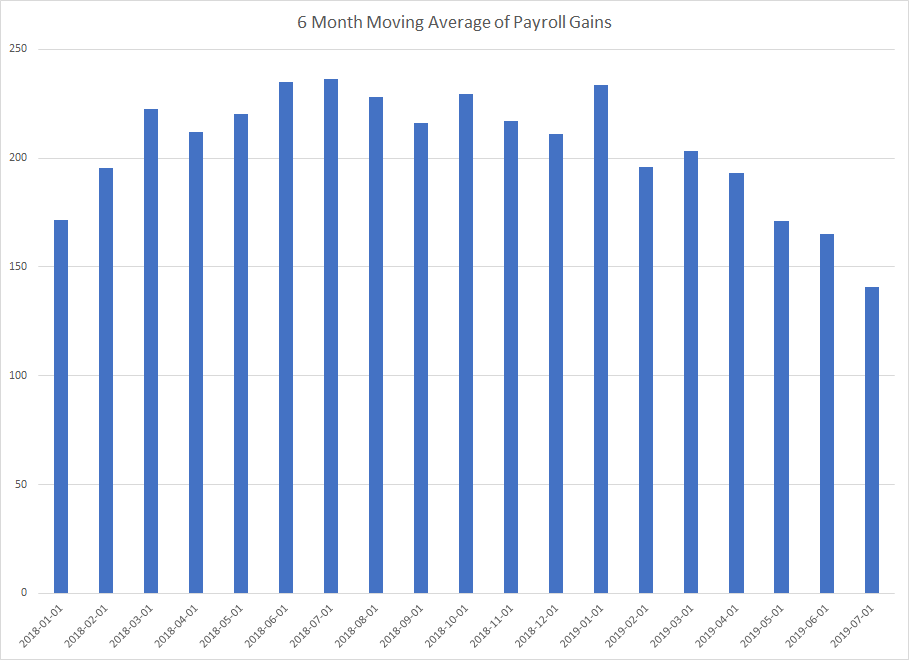
Data from the St. Louis Federal Reserve System; author's calculations
This number started to decline in July 2018 -- a trend that started to accelerate in 2019. Here's a longer chart of the six-month data to put it in perspective:
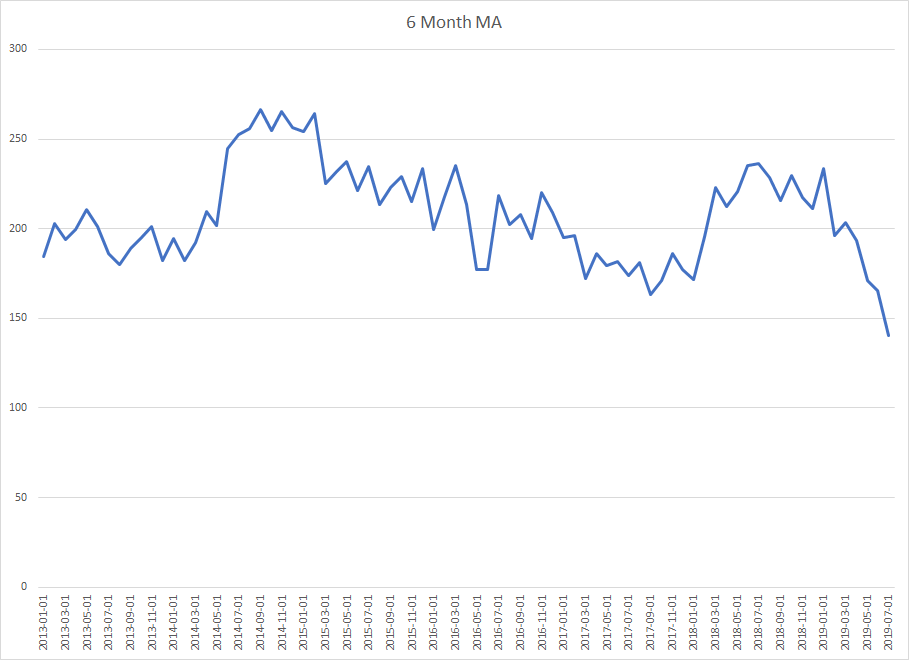
Rather than moving lower slowly (see the decline from early 2015 to late 2017), the latest decline is sharp, indicating an increased pace of weakness.
Please see conclusion at the top.
