The Hoot
Actionable ideas for the busy trader delivered daily right up front
- Tuesday lower.
- ES pivot 1937.42. Holding below is bearish.
- Rest of week bias lower technically.
- Monthly outlook: bias higher.
- YM futures trader: no trade.
Last night I called Monday's close lower so you can imagine my astonishment when I woke up this morning at the crack of 11 to find the market up and moving higher. Just as I was about ready to give up though, it abruptly reversed course and the Dow closed with a gratifying 123 point loss to end the month with a win for me. With my faith in the technicals restored, let's move on to see if March will roar in like a lion, or bull, as the case may be.
The technicals
The Dow: On Monday the Dow peaked jut before lunch and then spent the rest of the day sinking, thus confirming last Friday's dark cloud cover/spinning top. Monday's loss was enough though to send the indicators just off overbought though the stochastic remains threaded out and thus has no predictive power. Everything else still looks bearish here however.
The VIX: Last night I said that "this chart looks higher for Monday" and that's just where it went, up 3.74% after a successful test of its 200 day MA at 18.42 before closing back over 20 again on a very tall doji star. Indicators continue rising off of oversold though so it's not clear if the candle or the momentum will prevail on Tuesday.
Market index futures: Tonight, all three futures are lower at 12:21 AM EST with ES down 0.32%. Like the other charts on Monday, ES tried early to advance, but after just touching its upper BB early on, it fell back to finish with a fat red inverted hammer. That was enough to just send the indicators off overbought but the new overnight is giving us a new bearish stochastic crossover as ES continues falling. This doesn't look good for Tuesday
ES daily pivot: Tonight the ES daily pivot falls from 1950.92 to 1937.42. That still leaves ES below its new pivot so this indicator continues bearish.
Dollar index: Last night I called the dollar higher for Monday and it did that, though just barely with a 0.04% squeaker on a stubby red candle for 2/3 of an evening star. With indicators clearly overbought this really looks negative for Tuesday.
Euro: Last night I wrote that "I see nothing bullish here for Monday". Neither did the euro as it kept right on sinking, this time to 1.08850 on a lopsided red spinning top. Indicators continue oversold but the new overnight is moving lower again. So in the absence of any reversal signs it looks like there's more downside available here on Tuesday.

Transportation: On Monday the trans confirmed Friday's inverted hammer with a 0.81% decline in a move that sent all the indicators continuing lower off of overbought. The net impression here is continued bearish.
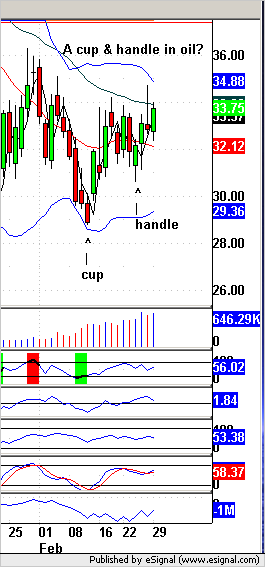
Oil: Hey, take a look at this. This is starting to look suspiciously like a cup and handle in oil. If it plays out, that would be quite bullish as this is generally a high probability pattern.

The first day of most months is historically higher but that, oddly enough is not the case for March..And with confirmation Monday of last night's bearish chart patterns, I'm afraid March will start off with Tuesday lower.
YM Futures Trader
No trade tonight.
