Monthly S&P 500 Emini futures candlestick chart:
Unprecedented rally

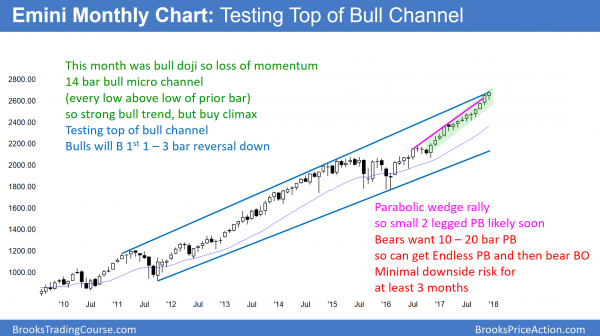
The monthly S&P 500 Emini futures candlestick chart has gone for an entire year with every low above the low of the prior month. December, in fact, is the 14th month in the streak. This month had a small bull body. This is a sign of loss of momentum.
The S&P 500 cash index’s monthly candlestick chart ended 2017 without a pullback. This is only the 2nd time in the 95 year history of the S&P 500 cash index that this has happened. The other time was 1995. That streak lasted 13 months, and it was much longer than any prior streak. At 15 months, the current streak is therefore the longest in history. January of 1996 traded below the December 1995 low, ending the streak. After a 1 month, 4.6% pullback, the rally that followed over the next 5 years tripled the value of the stock market.
Markets have memory. Since the last streak was similar in duration and pulled back in January, there is an increased chance of this January falling below the December low. Furthermore, when historical extremes are exceeded, the new extreme is usually not much greater. Therefore, the odds are that the current streak will end soon. Finally, December had a smaller body than the past 3 months. This loss of momentum increases the chance of a pullback in January.
A long micro channel is a buy climax
While a micro channel lasting more than 10 bars is unsustainable and therefore climactic, it is also a sign of very strong bulls. Consequently, the bulls will be eager to buy once they finally get a chance to buy below the low of the prior month. Hence, when the pullback comes, it will probably last only 1 – 3 months before the bull trend resumes.
Because a protracted micro channel is a buy climax, the bulls become exhausted. Hence, the trend resumption that follows is often brief. This means that there is at least a 50% chance that the rally after the pullback will last about 5 months. The next pullback will probably last longer and be deeper than the upcoming 1st pullback.
Minor stock market correction over the next several months
There is only a 20% chance of a 20% correction without at least a micro double top first. This means that the bears usually need a pullback and then a test of the old high before they can take control. This would take at least 3 months, and usually more. Even then, the odds are that the correction would still only be 5 – 10%.
When a bull channel is as tight as this one has been for more than a year, the 1st correction, even after a micro double top, will probably form another bull flag. Therefore, bulls will keep buying reversals over the next 6 months. This will therefore limit the downside in the 1st half of the year.
2018 will be more volatile, but still bullish
Because buy climaxes exhaust the bulls, the market often enters a tight trading range for 5 – 10 bars. As a result, 2018 will probably be more volatile. The pullbacks will come more often, last longer, and be deeper. However, the odds of a reversal into a bear trend in 2018 are small.
For a major trend reversal, the bears will need a strong minor reversal down, and then a rally to around the old high. That process typically takes at least 10 bars, which means a year. Only rarely the bears can get a huge reversal without a clear top.
Alternatively, they can get an Endless Pullback. This is a minor pullback that keeps adding bars. After 10 – 20 bars, the bears then have a 40% chance of a bear break below the bull flag. Consequently, the bears will need a year or more before they can take control. Any selloff before then will probably be minor. A minor reversal is one that becomes either a bull flag or a bear leg in a trading range, and not a bear trend.
Volatility Index
The VIX, which is the volatility index, spent most of 2017 around 10. This is unusually low, and it means that there has been very little volatility. Volatility simply is a measure of the size of the swings up and down. Because there has not even been a single 3% pullback in 2017, a trader does not have to look at the VIX to know that the volatility is low. Looking at the monthly chart immediately tells him that there is little volatility. Because the Emini will begin to have pullbacks in 2018, especially after the 1st quarter, the VIX will probably hover closer to 13 in 2018.
Weekly S&P 500 Emini futures candlestick chart:
Bull breakout above bull channel usually fails

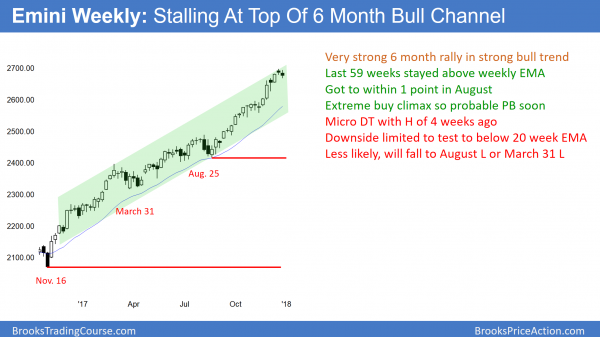
The weekly S&P 500 Emini futures candlestick chart has been above the top of an 8 year bull channel (see monthly chart) for the past 4 weeks. In addition, it has not touched the 20 week exponential moving average in 59 weeks. However, this week traded below last week’s low. Last week was a bear bar and a higher high double top with the high of 4 weeks ago. This therefore could be the start of a pullback to the moving average/
The weekly S&P 500 cash index’s candlestick chart has never been this overbought in the 95 year history of the S&P. The cash index stayed above its 20 week EMA for 62 weeks in 1995 and 1996. However, the pullback began at the 55th week, and the index went sideways for 6 months. There was no Emini back then since it was created in 1997. Since is tightly mirrors the cash index, it is reasonable to look at the cash index for historical patterns.
The current streak is 59 weeks, and there is no convincing pullback yet. While last week traded below the prior week’s low and both weeks had bear bodies, the bodies are small. The bears need 3 – 5 small bodies or 1 – 2 big bodies to convince traders that the pullback has begun. Because the current price is far above the average, a selloff will likely take several weeks to get down to the average. Consequently, the odds are that this streak will surpass the earlier one in the cash index.
Upcoming 20 Gap Bar buy signal
The bulls have been so eager to buy that they have been willing to pay above the average price for more than a year. There is a gap below the low of ever bar and the moving average. This makes all of these bars “Gap Bars.” When a market stays above its 20 bar EMA for 20 or more bars, it creates a 20 Gap Bar buy setup. This means that the bulls typically buy at the EMA. They will likely do so when they get a chance within the next few months.
When a market stays above its average for 40 – 50 bars, it is usually exhausted. Consequently, the bulls often will not immediately buy at the moving average. They often wait 10 or more bars before buying aggressively again. As a result, the first pullback might last 2 – 3 months.
Bull breakout above 9 year bull channel
Because the bull channel is tight on the weekly chart, the odds are that the 1st reversal down will be minor. This means that it will either form a bull flag or a bear leg in a trading range. If the selloff lasts a few months and falls 100 or more points, a trading range will be more likely.
There is a 70% chance that a bull breakout above a broad bull channel will fail within about 5 bars. While the current channel has lasted 9 years, it is not broad. Consequently, the odds are against a reversal down to the bottom of the channel over the next year. Yet, the top of the channel is resistance. Therefore, the rally will probably begin to pause.
Why buy if a reversal is likely soon?
Since the weekly chart is at resistance, the odds favor a sideways to down pullback beginning in the next month or so. However, many bulls will keep buying as the rally continues, despite the buy climax. They hope that the market keeps going up so that they can make an immediate profit. However, they know that the yearlong bull channel is tight. Consequently, the reversal has an 80% chance of forming either a bull flag or a bear leg in a trading range. In either case, if they manage their trade well and are willing to scale in, they have an 80% chance of making money, or of at least avoiding a loss.
A bull flag means that the bull trend will resume within 10 bars or so. A bear leg in a trading range means that the 1st selloff will be the start of a trading range. A trading range has legs up and down. Therefore, the 1st selloff will lead to a rally back up to the high. This will allow bulls who bought at the top to avoid a loss. If they bought more during the selloff and exited at the high, they could get out breakeven on their 1st buy and with a profit on their lower buy. As a result, there is not much risk of an experience trader losing money even if be buys at the top of this rally.
Daily S&P 500 Emini futures candlestick chart:
Trump Emini rally continuing in 2018, but more volatile

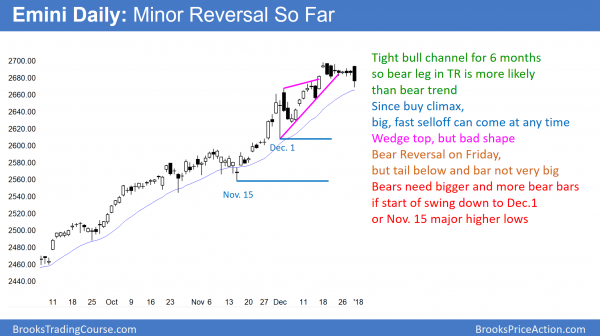
The daily S&P 500 Emini futures candlestick chart is in a strong bull trend. Because the wedge top does not have a good shape, the probability of a reversal is less. Friday was a bear breakout, but the body was not very big and the bar had a prominent tail below.
The daily S&P 500 Emini futures candlestick chart is in a strong bull trend. The size and number of bear bars increased in December. This is a sign of selling pressure and it increases the chances of a pullback. Friday was a bear reversal bar, but is was not very big and it closed above its low. While it might be the start of a 3 – 10% correction, the bears need to do more. If the bears get consecutive big bear bars or 3 – 5 consecutive average bear bars, traders will be more willing to sell.
All pullbacks in 2017 in the Emini and the cash index have been less than 3%. As of Friday, the last trading day in 2017, there have been 423 calendar days and 289 trading days since the last 3% correction. This is by far the longest streak in the 94 year history of the S&P 500 stock index. Consequently, there is a 70% chance of a 3% correction within the next few months.
Does a correction need a catalyst?
The market often has a catalyst that leads to or coincides with the start of a pullback. Sometimes it clearly causes the pullback. It frequently is impossible to tell if it is simply a coincidence in an overbought market that was likely to pullback. If a pullback is 5% or more, traders correctly conclude that the catalyst was not enough of a reason for the selloff. Instead, traders were simply taking profits in an overbought market.
The January 19 congressional vote on the budget is the next obvious candidate. However, any unexpected event can be a catalyst as well. In addition, many selloffs begin without a clear catalyst. Furthermore, they often begin with good news. Consequently, even if the budget vote leads to s strong 1 – 2 day rally, the bulls might use it as an excuse to take profits.
Seasonal tendencies are mostly coincidences
Throw a deck of card up in the air, and then find the ones that land face up. Throw those up again, and again repeat the process until there is only one card that lands face up. Let’s say it took 7 tries, and the final face up card was the 4 of hearts. You might then conclude that there is maybe a 90% chance that the 4 of hearts will always be the final card. Or, with a little thought, you might conclude that the 4 of hearts has only one chance in 52 of being the final card if you keep repeating the game.
I bring this up because there are countless similar games that you can play as a trader. If October 16 is higher than the day before or the month before or 3 months before in 18 of the past 20 years, is there really something special about October 16, or is it the 4 of hearts?
Geese don’t lay Golden Eggs
Sometimes mathematical things seem perfectly simple and clear, but are often much more complex. Just think about this for a moment. If there was a Golden Goose laying golden eggs, how long would it be before institutions discovered they are constantly giving you money? Not long. Consequently, the majority of even the best calendar trades are difficult to trade profitably. Why does Buffet buy and hold for years? It’s because he knows that timing in and out based on calendar tendencies is a losing strategy.
Everyone knows the math behind “Sell in May and Go Away.” The math is clear (not really). If a trader buys in the middle of October and exits all of his positions in early May, he will make more money than if he held for years. At least, that is the theory. In fact, when researchers consider many variables, they conclude that buy and hold is a better strategy. Therefore, even the best, most revered, most discussed calendar trade is a fraud.
List of January tendencies… for entertainment only!
I want to begin by saying I do not believe in calendar trades. I would never trade any of the tendencies below. However, as a trader, it’s fun to know they exist. Knowing some secret handshakes like these can make you feel more like one of the guys or gals on Wall St.
Every year is up 68% of the time and down 32% since 1927. January, like most months, is usually up. The January tendency to rally after yearend tax selling is called the “January Effect.”
In any 5 day period, there is a 56% chance of the market being up.
The last 5 days of the year have a 77% chance of being up, and 10 times more gain than the average 5 day period.
If the 1st 5 days of January are up, January is up 76% of the time. However, all months are up 65% of the time. This therefore is only a small improvement.
When the first 5 days are negative, January is down 60% of the time, instead of only 35%. This is called the “January Barometer.”
If January is up, the year is up 82% of the time, and the average gain from February to December is 8.5%.
When January is down, the average gain from February to December is only 1.7%, and the year has a 58% chance of being down, instead of the usual 33%.
If January is down 6%, then the entire year is down 5%. As a result, the rest of year is up only 1%, so the gain is small.
In January over the past 90 years, small cap stocks are up 4% and large caps are up only 1.5%. It is better to focus on small caps.
