Wonder what's led to the appreciation of the Oceanic currencies for a second straight day? Weren't we in a 'risk off' profile that would suppress the value of these currencies? How come the Yen has sold off so aggressively off the highs? Why is the Swiss Franc or the Euro reversing at these particular levels? Today's reports tries to shed a light on all these questions and many more...
Quick Take
The pick up in risk appetite, in what I call ‘true risk on’, as both equities and bond yields in the US rose strongly in tandem, led to a further reprieve in the Oceanic currencies (AUD, NZD). The currencies were catapulted into higher ground for a second straight day, also aided by an RBA policy meeting and subsequent speech by Lowe today, with both events failing to make a strong case with regards to the RBA ready to ease policy any further in the short-run. The Kiwi found its wings again as the NZ employment report saw a significant reduction in the jobless rate, even if the details were troublesome as the change in employment and participation were down. On the other side of the G8 FX spectrum, the Yen was smashed lower as the ‘risk on’ flows in equities were maintained at a steady pace throughout the three sessions (Asia, Europe, US). The easing measures, aka bazooka, by the Chinese government, of which I provide details in today’s report, have proven to be an effective tool to combat the panic selling on the back of the coronavirus, a crisis that still remains well and alive even if the Chinese government is doing all it can to massage the number of cases and the death toll to avoid the chaos that may emerge. The Swiss Franc also found solid sellers in line with the improved risk profile, even if the currency remains in a steady bullish trade premise since the start of the year. The Pound, after being hammered following the European Commission unveiling of its draft mandate for upcoming negotiations with the UK, which was interpreted as bearish for the future prospects of reaching some mid-ground on trade negotiations, saw strong buying off the lows. Encapsulated in between we find the USD, EUR and CAD, which saw limited flows on Tuesday.
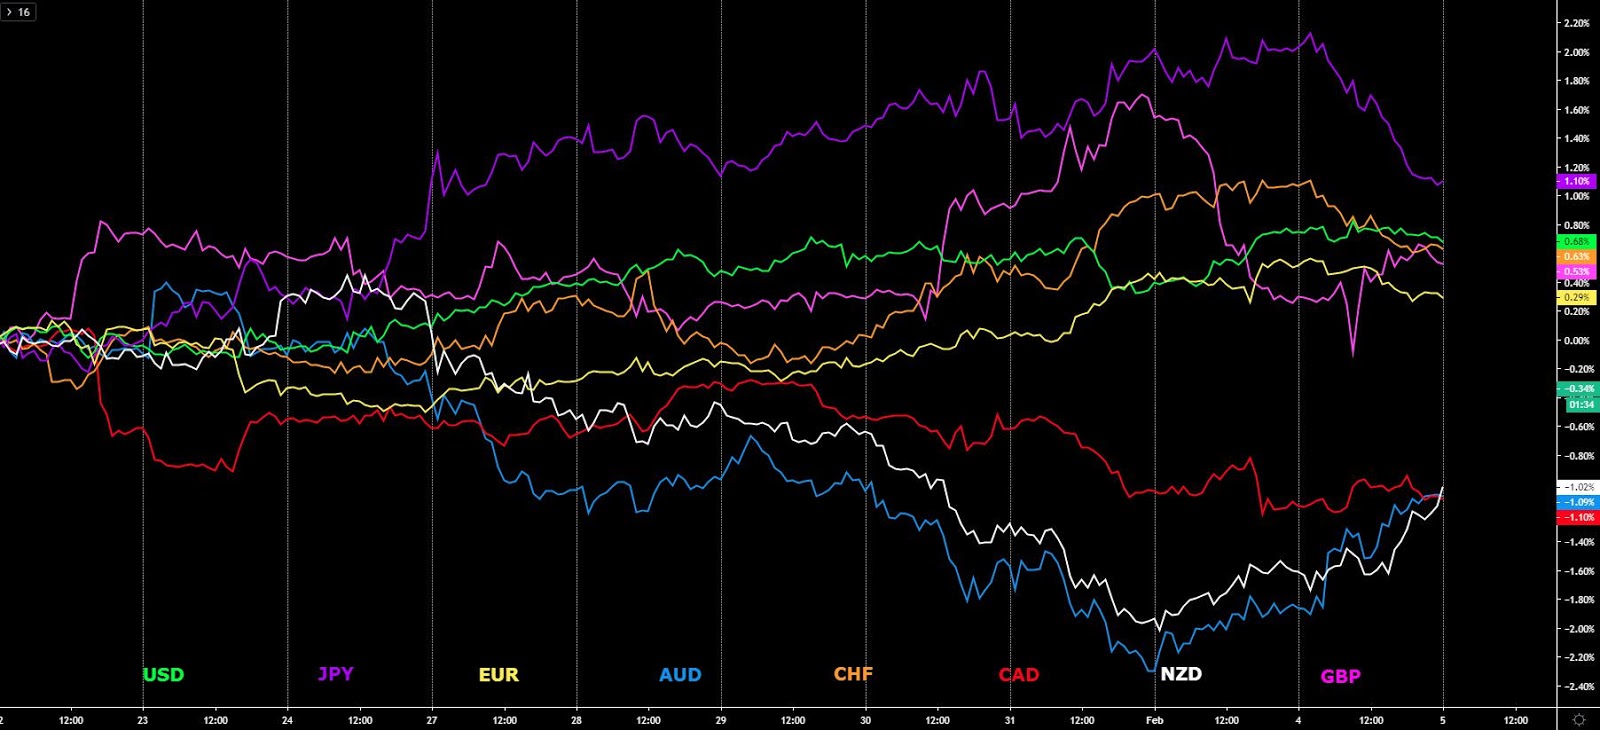
Narratives In Financial Markets
* The Information is gathered after scanning top publications including the FT, WSJ, Reuters, Bloomberg, ForexLive, Institutional Bank Research reports.
A day of ‘true risk on’: The risk tone was greatly reinvigorated in the last 24h, in what appears to be a combination of the market giving its blessing to the recently introduced measures by China’s government to support its economy through massive liquidity injections into the system, alongside a reduction in the number of alarmist headlines related to the Coronavirus impact on the global economy. In the charts section, I go more in-depth in the rise of equities/yields/commodities/yuan, as well as the large gains printed by currencies most sensitive to the current drivers such as the Aussie. The Nasdaq index rose by more than 2% as it kissed new record highs.
Chinese equities boosted after the government measures: The equity market in China rose by over 2.5% (China’s CSI 300 index stood at 2.64%), setting the ball rolling for a positive lead in the equity space in European and US markets. Even if the news-dipping as it relates to the coronavirus continues to suggest the diseases keeps spreading at a rapid pace, the market cares about the evolution of it, and in this front, it appears as though, at least based on official numbers (largely rigged but that’s what’s used as reference), there has been a deceleration with the number of reported cases 20,500 and 425 deaths in mainland China. These massaged numbers serve as a circuit-breaker of sorts as it suggests that the Chinese government measures to contain the virus outbreak may be working.
WHO downplays the coronavirus: The Director-General of the World Health Organization Mr. Tedros, in his latest official statement, helped to feed the risk rally by downplaying the coronavirus. Tedros sounded critica about the rest of the world imposing travel bans or trade restrictions on China, advicing to lift such dramatic measures as they can cause "fear and stigma" towards the country. So far, 42 nations have officially reported trade or travel related measures of length to coronavirus, which according to Tedros, “should be short in duration, proportionate and considered regularly.”
Recap of the Chinese measures so far: Nomura’s Chinese Economic Team shared a handy recap of the actions taken by the Chinese government so far, including “The PBoC did cut the OMO rate by 10bps. At the same time, on Monday, the PBoC injected RBM 2.1T of short-term interbank liquidity, which against currently maturing loans, saw total liquidity in the banking system ~ RBM 900B higher vs 2019. The next day, the PBoC injected a further RMB 400 billion in reverse repo liquidity, marking the largest single-day addition since January 2019. The CSRC suspended securities lending from Monday until further notice, with some funds receiving so-called “window guidance” from regulators to avoid actively selling stocks. The CSRC told brokerages that their prop traders “aren’t allowed to be net sellers of equities this week” (Bloomberg). The CSRC also said it would halt night sessions for futures trading and allow some share pledge contracts to be extended by as long as six months. The MoF announced an interest subsidy scheme for new loans ear-marked for medical supply companies fighting coronavirus. The MoF announced policies to extend loans to entrepreneurs and SMEs which have been hit-hard from the coronavirus, as well as potentially delay mortgage repayments or adjust credit policies to repay the loans for those individuals or entities who may have temporarily lost sources of income.”
Fiasco in the Iowa caucus: Former South Bend Mayor Pete Buttigieg won Monday's Iowa caucus after amassing 26.9% in the state delegates count, followed by Sens. Bernie Sanders in second (25.1%), even if Sanders won the popular vote with 27,088 vs. Buttigieg's 23,666. Elizabeth Warren came third (18.3%) according to Iowa Democratic Party (IDP) Chair Troy Price. The bad news was that former Vice President Joe Biden, the so-called Democratic 'frontrunner', came in fourth at a very disappointing 15.6%. The event has been dubbed a fiasco, not only due to the defeat by Biden, but because the app meant to be used to submit the results stopped working and the Iowa caucus ended with delays on reporting the official results until the next day. These events have led to a boost in the chances of a Trump re-election according to betting sites, which is yet another reason why we’ve seen such a boost in stocks. Even Michael Bloomberg is now going to get a chance as he has surpassed Biden to be the Democratic ‘nominee’. While Iowa is a relatively small state that allocates just 1% of the delegates candidates earn to the nomination, it holds disproportionate significance in the process as it’s the first state to cast its ballots for the presidential nomination. The eventual Democratic nominee won the Iowa caucuses in six out of the past eight competitive Democratic presidential primaries” BI added.
RBA’s Lowe sustains AUD momentum: RBA Governor Lowe delivered a speech titled “the year ahead” at the National Press Club, noting that he “can see the case for further easing but there are risks”, detailing that the “benefits right now do not outweigh risks” even if acknowledging that “this could change”. Lowe said “if unemployment moves in the wrong direction, balance would change, no timeframe. Lowe added that “the RBA board will continue to discuss further monetary stimulus”, and that he “would be surprised to see negative GDP this quarter”, barring the coronavirus not contained.
SGP sold as MAS hints at room for easing: Singapore's central bank (MAS) said there is room to ease given coronavirus concerns. The Central Bank stated that there's sufficient room within the policy band to accommodate easing of the Singapore dollar in line with the weakening economy due to the virus. Singapore dollar nominal effective exchange rate has been fluctuating near upper bound of policy band in recent months. The SGD was marked down on the news as the market factors in the negative input.
GBP recovers from oversold levels: The Pound saw a rebound off oversold territory, with partial attribution to the bounce courtesy of a recovery in the UK January construction PMI to 48.4 vs 47.1 expected. The entity commissioned to report the numbers (Markit) detailed that “the construction sector downturn lost intensity in January amid slower reductions in house building, commercial work and civil engineering activity. Measured overall, the latest dip in construction output was much shallower than in December, with survey respondents often commenting on improved willingness to spend among clients since the general election. Despite concerns about prospects for work on infrastructure projects, latest data revealed a strong rebound in business optimism across the construction sector as a whole in January. The degree of positivity reached its highest level since April 2018, driven by hopes that improving confidence among clients will continue to translate into new contract awards over the course of 2020."
Aussie gains post the RBA policy: The best performer on Tuesday, by a large margin, was the Aussie, emboldened not only by the pick up in risk appetite, but most of the mark up occurred on the back of the RBA policy release, announcing no change in rates, and judging by the statement from Philip Lowe, Governor of the RBA, the read by the market was not as dovish as one would have feared given the pressing issues to deal with such as the bushfires or the outbreak of the coronavirus in China, even if there was a recognition that it will temporarily weigh on growth. Some of the key headlines included that the RBA will keep easing policy if needed to support sustainable growth, noting that rates are set to remain low for extended period, with the developments in labour markets to be monitored very closely. The RBA stated that low rates are boosting asset prices which should lead to increased spending. The central scenario is for underlying inflation to be close to 2% in 2020 and 2021. On housing, the RBA sees signs of a turnaround in the housing market, especially in Sydney and Melbourne.
NZD finds its wings after mixed jobs report: The NZ Q4 2019 employment report came better-than-expected on the surface, but when scanning through the details, it wasn’t as rosy the picture that it portrays. The Unemployment rate stood at 4.0% vs. 4.2% expected, however, with the employment change at 0.0% q/q Vs 0.3% expected and the participation rate dropping to 70.1% vs 70.4% expected, it invalidates the good omen attached to the reduction in the jobless rate. In terms of salary inflation, private wages excluding overtime rose to 0.6% q/q vs 0.5% expected, while the average hourly earnings stood at 0.1% q/q vs 0.5% expected.
Oil still unloved as OPEC ponders output cuts: The price of Oil, however, continues to slide as the expectations of a major sump in demand coming from China, alongside no measures yet taken by OPEC, depresses the price. OPEC+ will decide on whether an earlier meeting is needed after technical panel recommendations. There are talks that the cartel is considering a cut in output of up to 1 mbpd but the baseline forecast is that the impact of the coronavirus on Oil will only cut 200kbpd of demand in a 'worst-case'.
Insights Into FX Index Charts
The indices show the performance of a particular currency vs G8 FX. An educational video on how to interpret these indices can be found in the Global Prime's Research section. The idea of this analysis is to complement one’s daily bias by accounting for this holistic analysis.
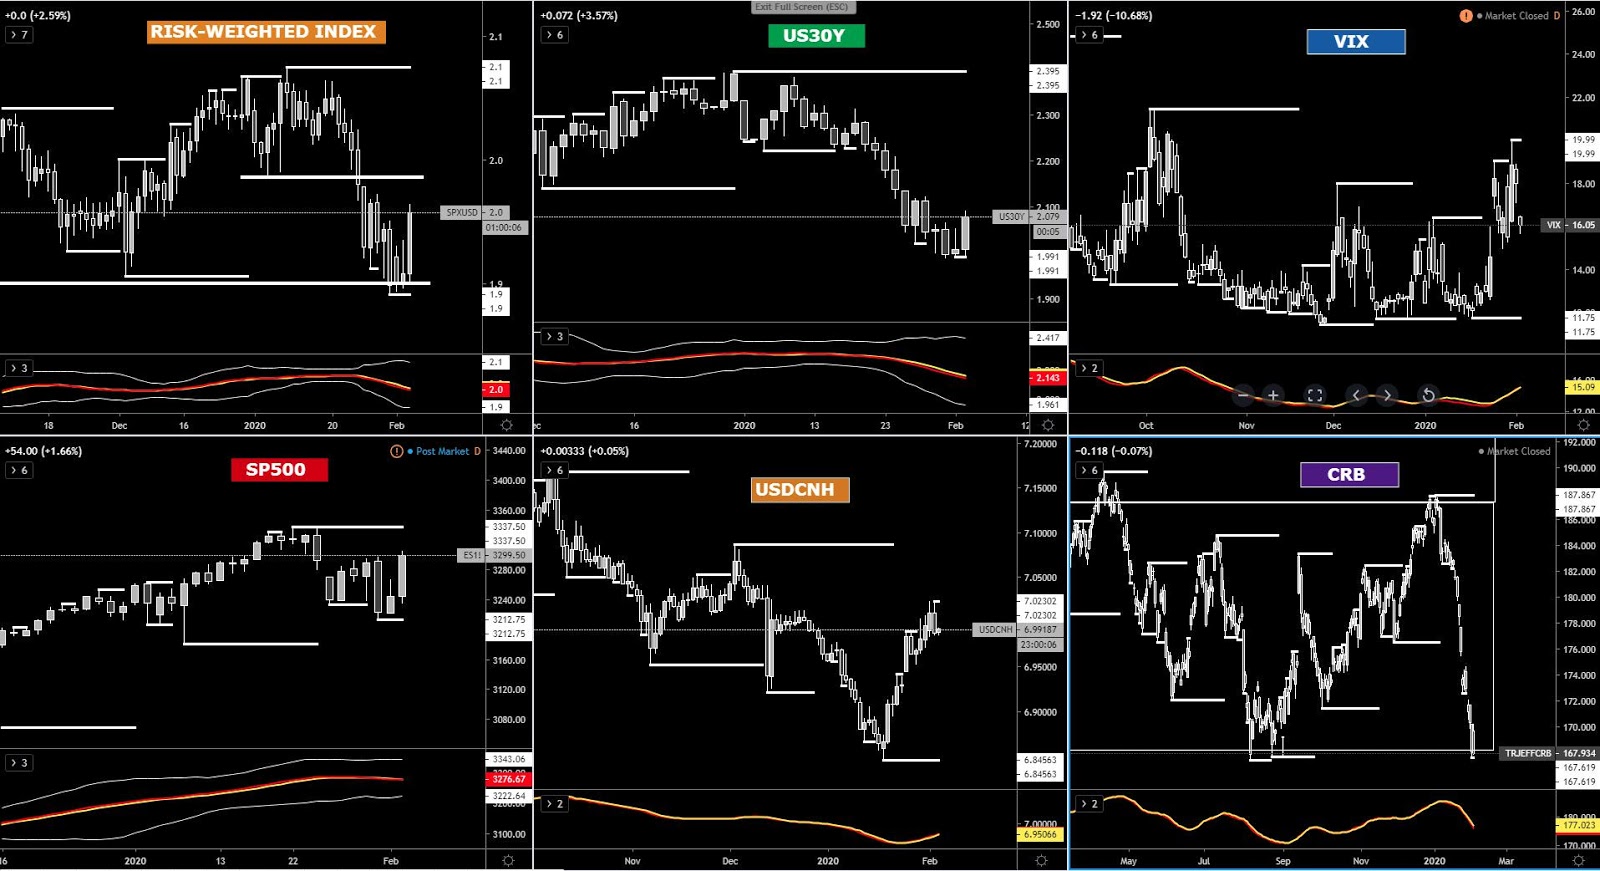
The risk dynamics have improved across the board, and by looking at the performance of the two bellwethers (S&P 500 and US 30-year bond yields), we can see what I dub as ‘true risk on’, which is an event that occurs when these two assets rise in tandem. The bolstering of the risk mood is also backed up by the strengthening of the Yuan vs the US Dollar (lower USD/CNH), the dampening of the VIX to 16.00 from the hefty 20.00 mark, while commodities have also seen an overall recovery as the widely followed Reuters CRB index reflects (at key support).
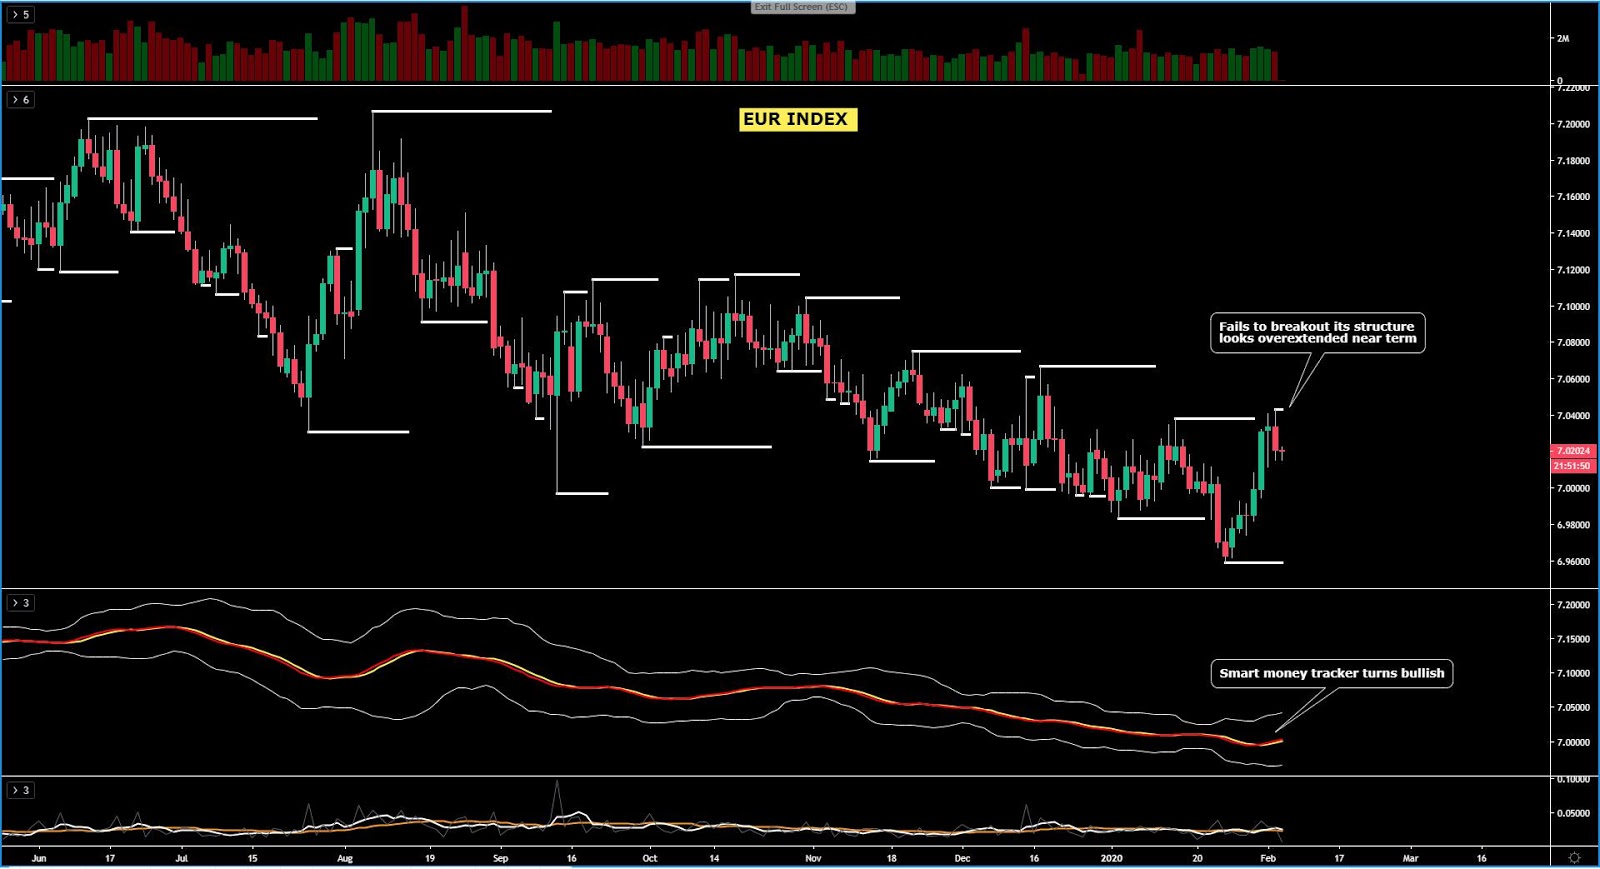
The EUR index has failed at a level of critical resistance, a juncture in the chart that was likely to see sell-side pressure pick up, as it was revisiting a key pivot level that had pre-luded a successful rotation into new lows. As said, I am not surprised in the slightest that the resistance has acted as a rotational point back towards a mean measure. At this point the daily shows not sufficient evidence of a directional bias as the order flow support further buying as per the smart money tracker, but this trade premise is not backed up by the price structure.
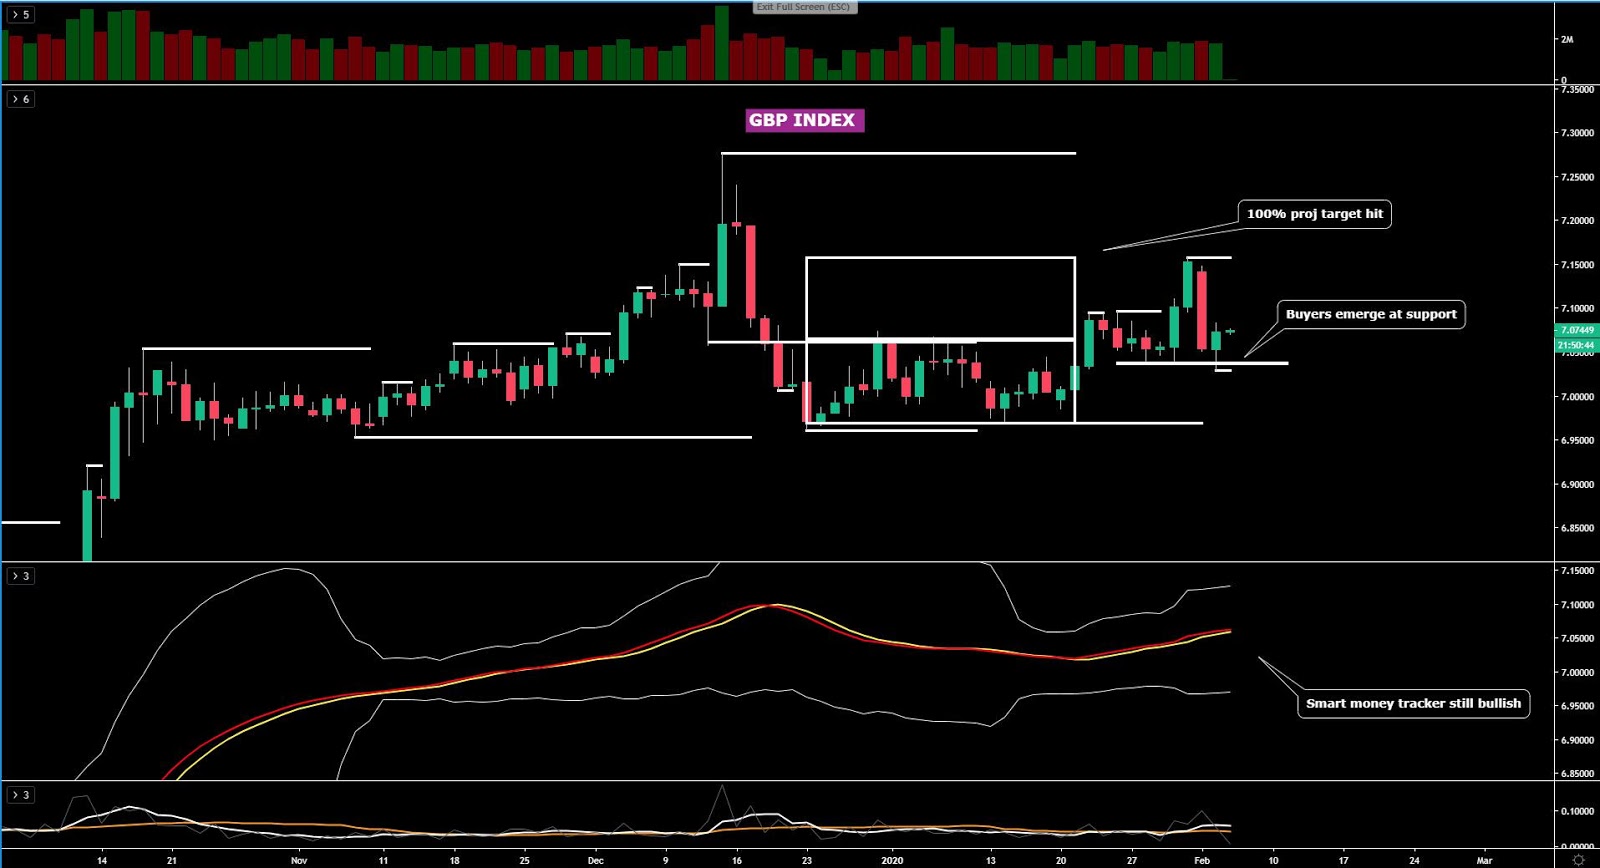
The GBP index, after it reached its 100% projection target, it was smashed hard to the downside until the price finally met another batch of strong buying at a reactionary level in the form of horizontal support, which has the added weight on being a pivot that acted as the precursor of a breakout in structure. A revisit of this pivot formation under this context offers technical discount as the price structure is still valid at a very cheap price. The establishment of a bearish cycle will only be validated if we see a breakout of this prior swing low with acceptance below. Until then, the prospects to see a recovery off this support are also a valid case.
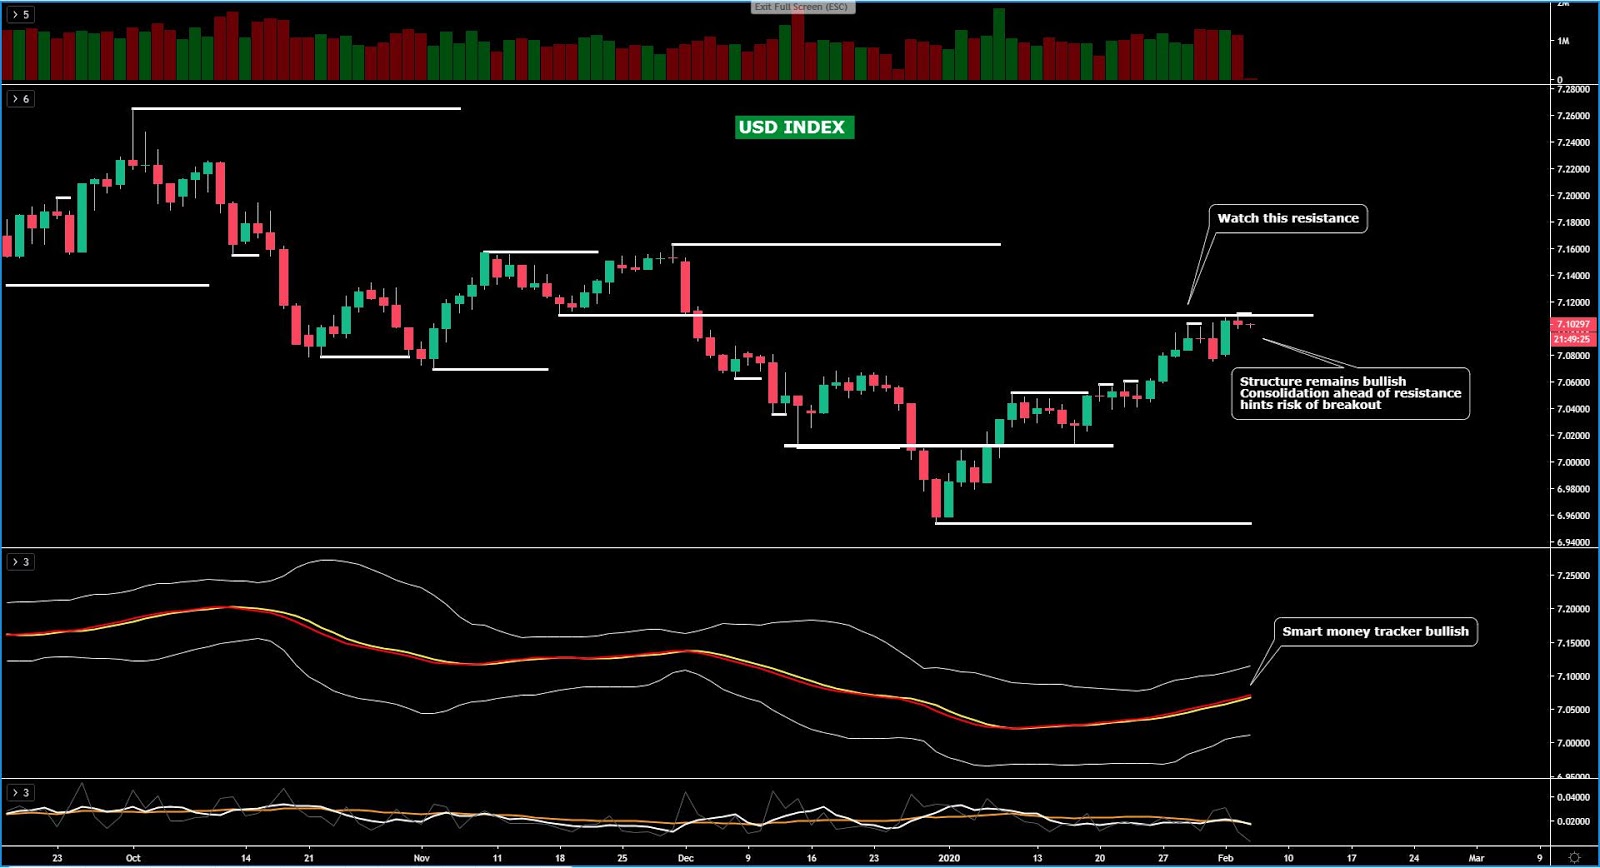
The USD index is setting up a potential breakout of the overhead resistance as the consolidation of a tiny candle right along this technical level of significance is never a good sign for the interest of sellers. This area remains a huge flection point (low Nov 19 last year), with a break of this high setting the stage for a possible extension towards the double top seen through Nov last year, which translates in the prospects of additional gains to the tune of 0.8%. However, by the same token, this resistance can still act as a location for price to pullback lower, but as I said, Tuesday’s price action is far from encouraging for sellers. Even if a setback were to occur, I’d still see this rotation lower as simply a correctional move in the context of a bullish market.
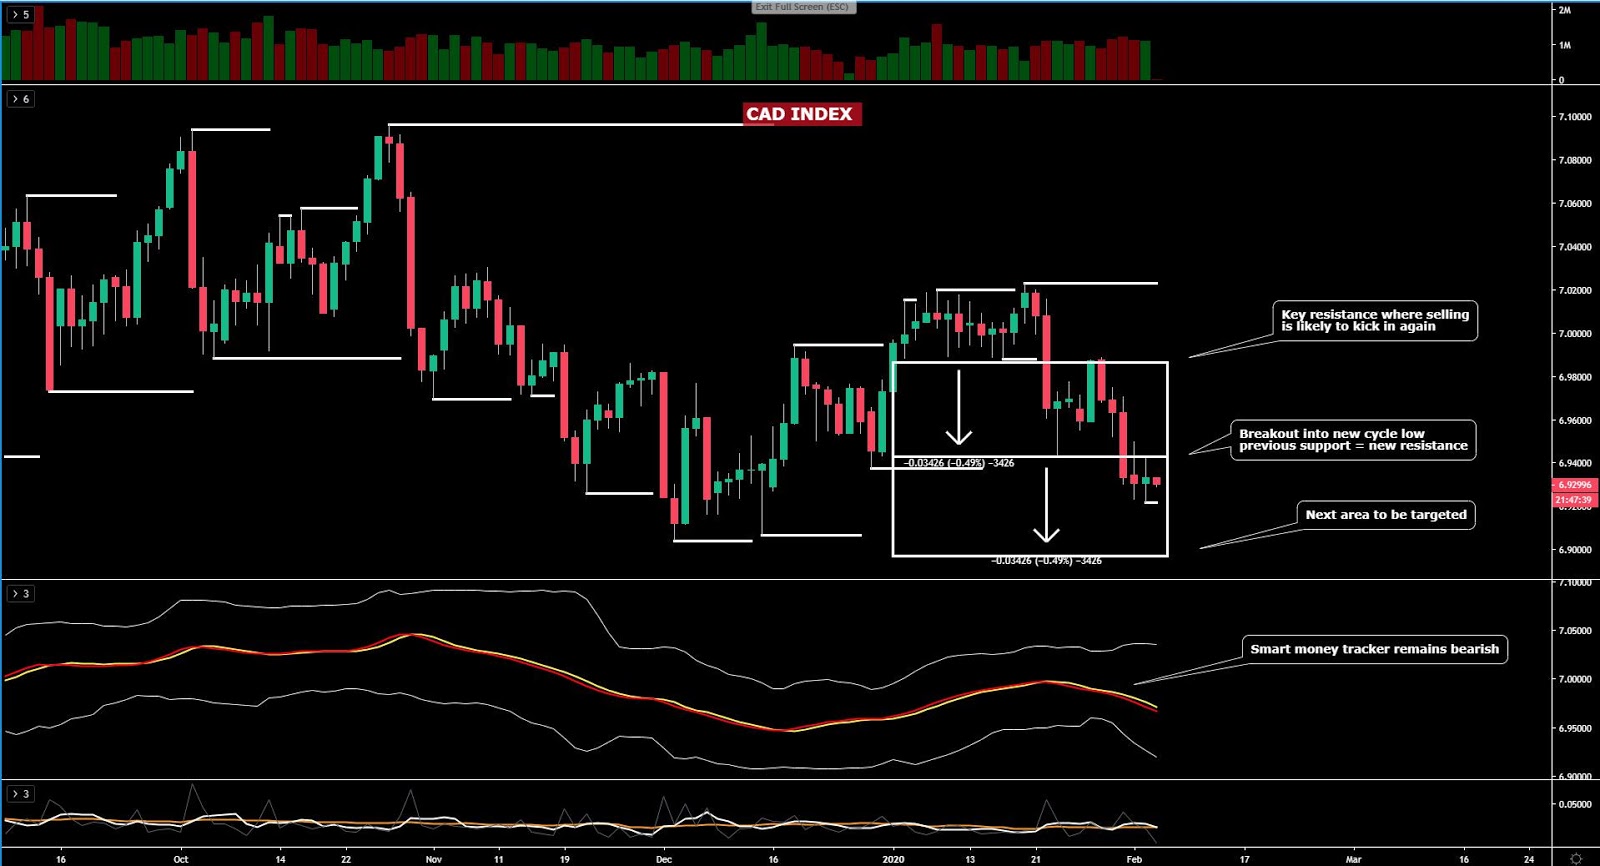
The CAD index shows no changes in the bearish outlook. If anything, the rejection of the prior swing low that acted as support and now turned resistance reinforces the notion of sell on strength as the main case to stick with in this market. The index is set to find further follow through continuation as part of its ongoing bearish cycle, with the risk clearly skewed towards a descend into fresh 2020 lows until the next 100% projection target is met. The bearish sentiment on the basis of a more dovish BOC, lower Oil prices, keeps weighing on the currency, alongside the confirmation of the technical overlay.
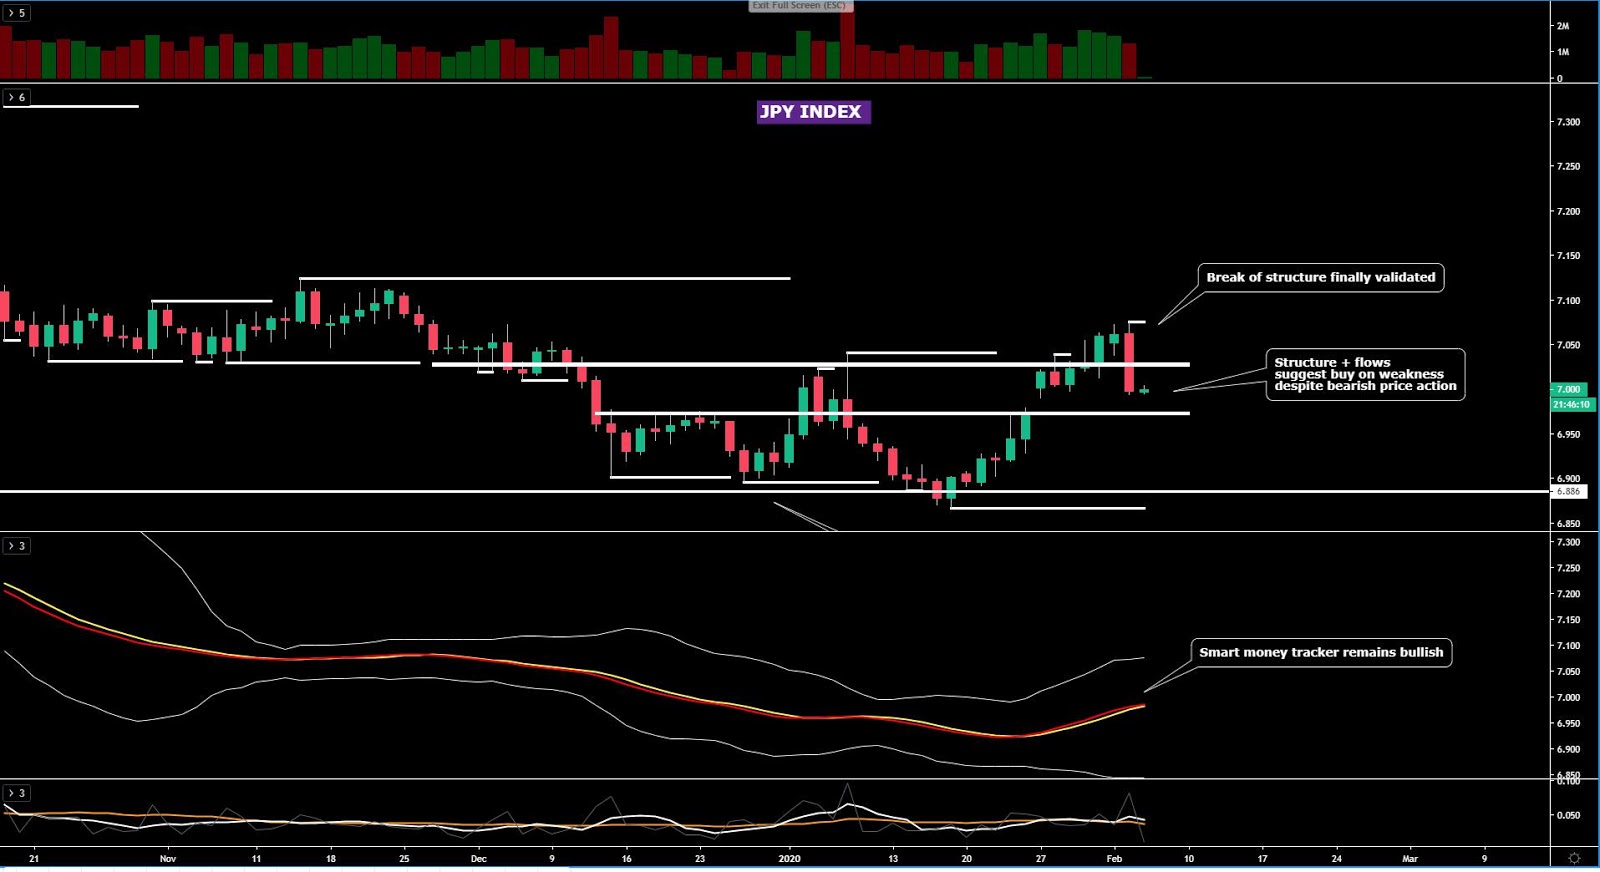
The JPY index, while dumped aggressively in the last 24h, still displays a bullish outlook based on the two most important factors to consider, that is, the daily price structure (higher highs) and the order flow dynamics (smart money tracker still signals momentum bullish). It remains my base case that the coronavirus will keep the Yen bought on dips . The breakout and acceptance above the previous swing high from early 2020 transitioned this market into a bullish trend, with the setback so far not clouding the bullish default view based on technicals.
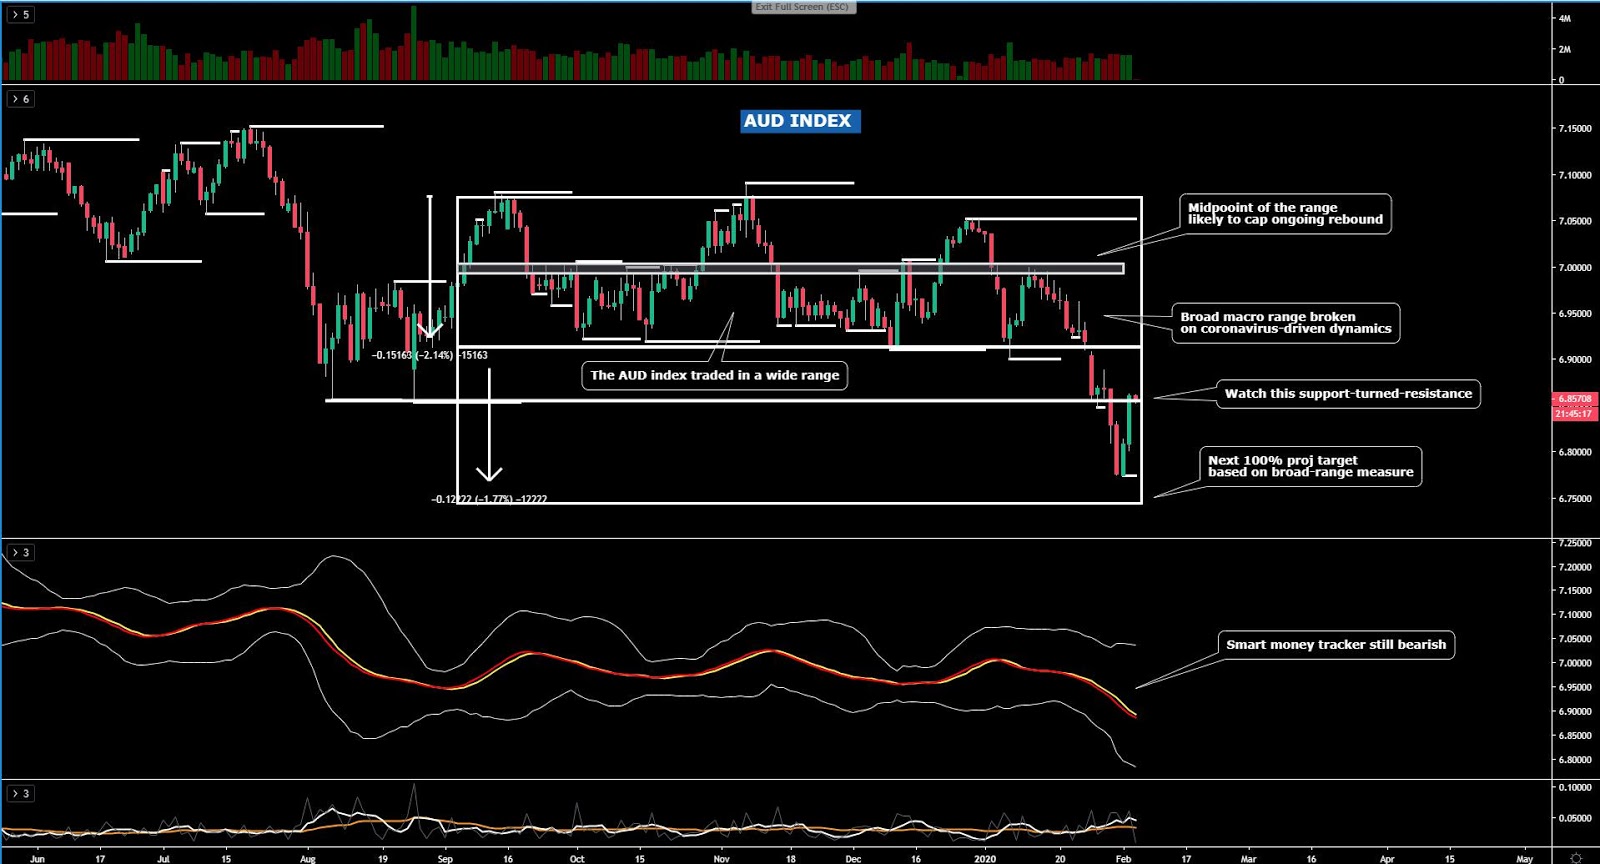
The AUD index keeps finding further buy-side interest off its overextended levels, with the latest leg found courtesy of the less dovish RBA and an invigoration of the risk profile. That said, this is a market that still shows a correction in the context of a bearish trend as the price structure and the smart money tracker slope communicate. I still believe there is more downside until the macro 100% projected area is reached in coming weeks, a scenario that would get invalidated the moment this market shifts its bearish structure (not expected this week). I did endorse staying away from Aussie shorts this week as there was no technical value trading, however, that’s starting to change as the currency enters now levels of technical significance to sell into.
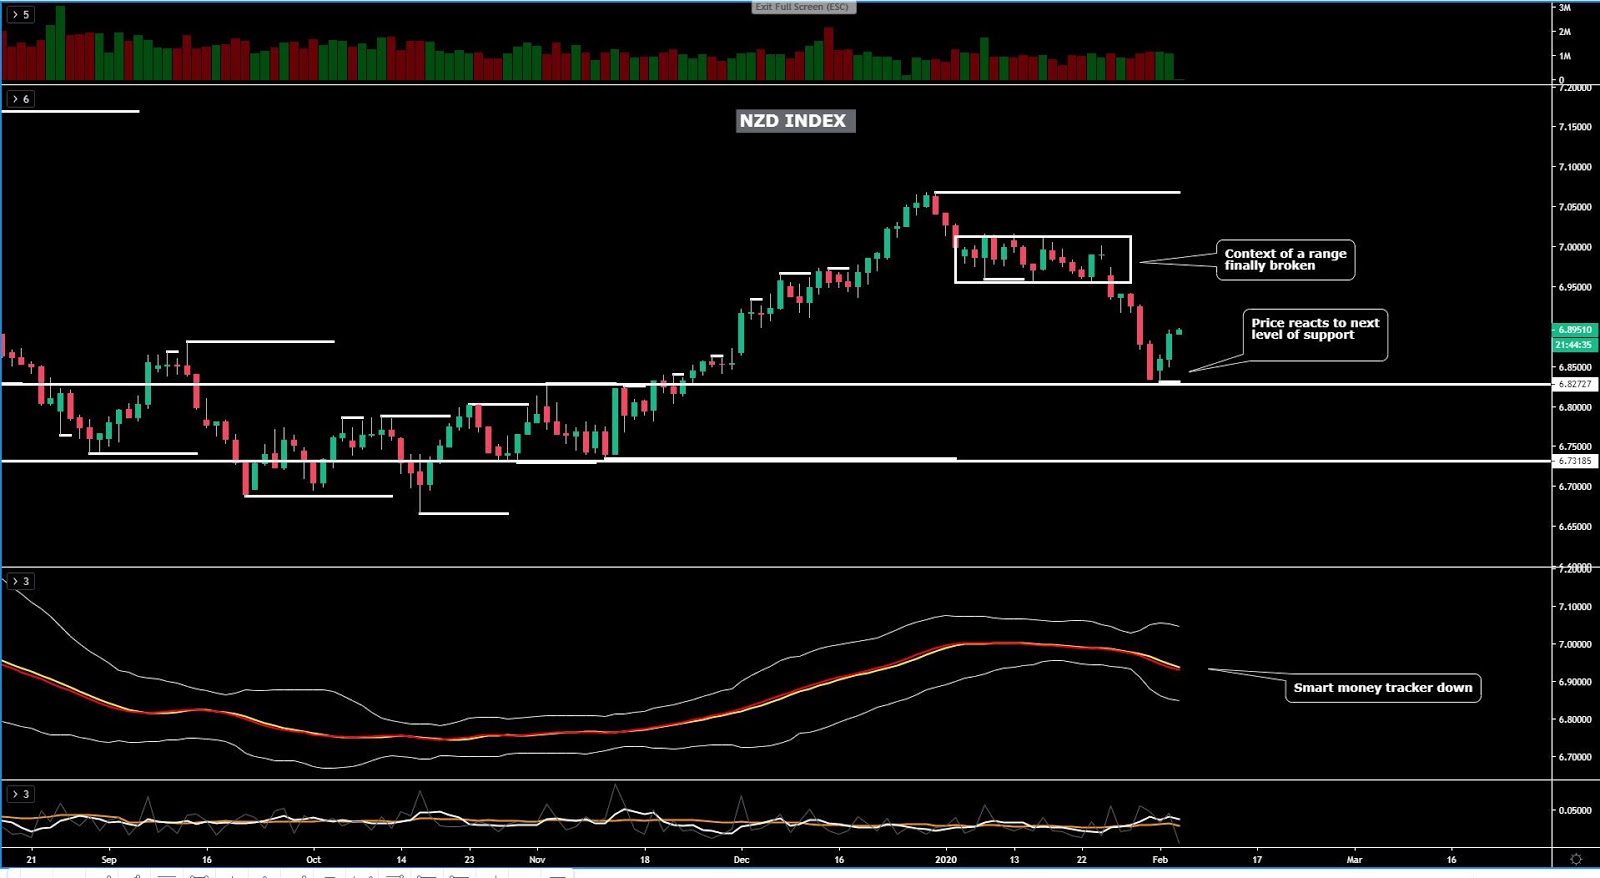
The NZD index found buying interest at a line of strong support, from where the bleed lower has come to a temporary pause. While the technicals are outright bearish, the NZD has definitely offered a good opportunity to play from the long side off this support. The levels it trades at, I must say, are far less attractive to keep adding into NZD long exposure as the price structure and the order flow via the smart money tracker imply the risk of shorts taking back control.
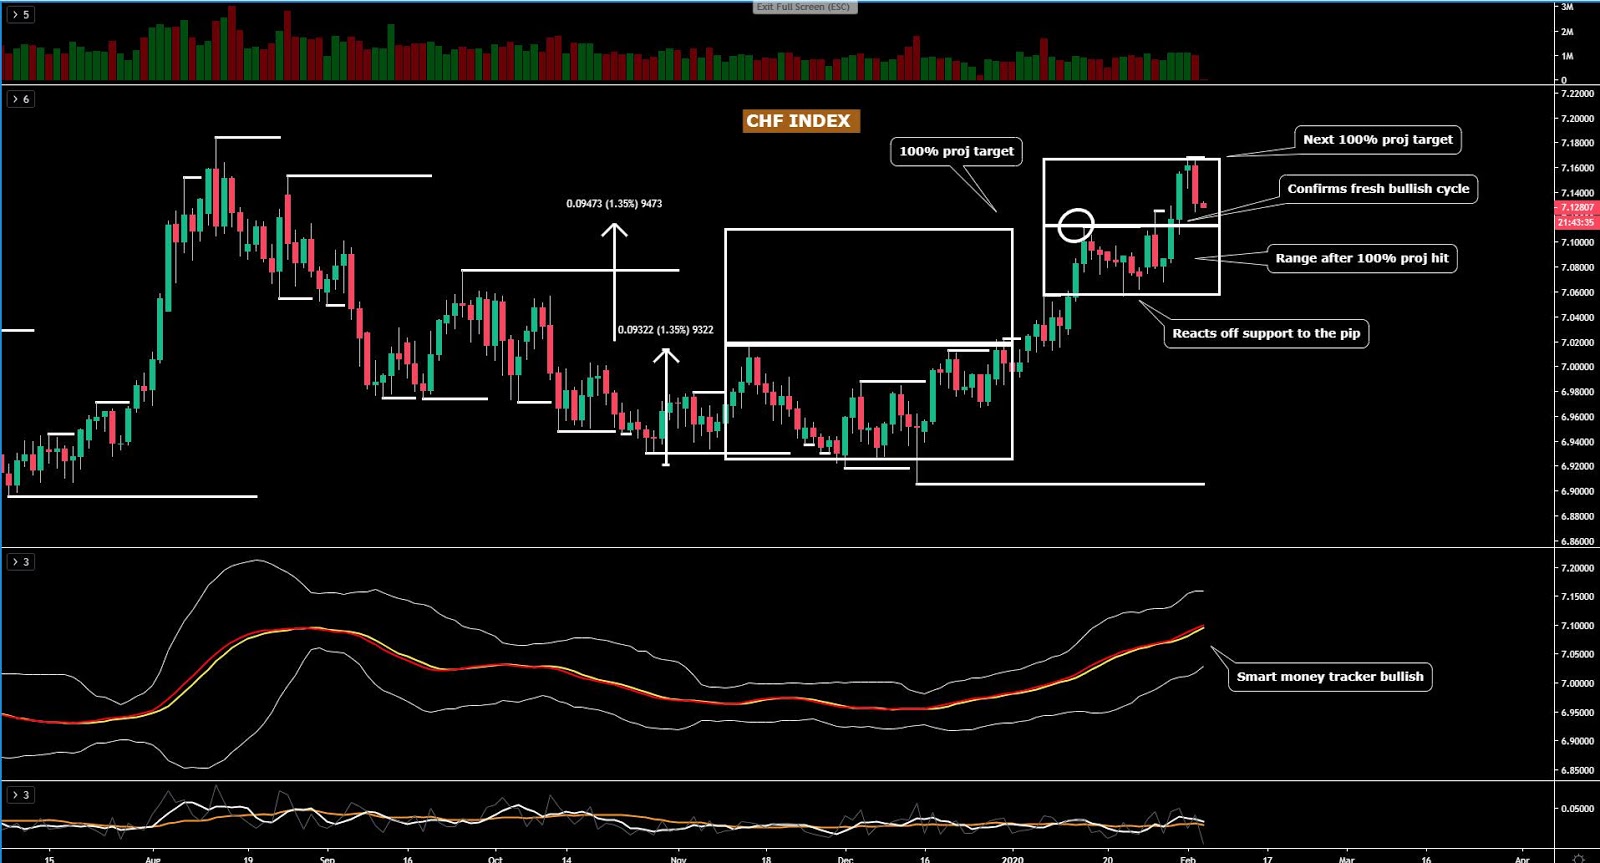
The CHF index, after breaking its 2-week consolidation phase and accepting levels outside its last bracketed area, extended towards its 100% measured movement, where a setback has finally ensued, taking the currency back down even if the bullish trend premise is retained. The move lower should be seen as correctional as the market structure is still displaying a nice upward stepping formation with the backing of the bullish momentum via the smart money tracker. These are attractive levels to start considering long-side business in the currency in line with waht’s arguably been the neatest bullish trend this year.
Important Footnotes
- Market structure: Markets evolve in cycles followed by a period of distribution and/or accumulation.
- Horizontal Support/Resistance: Unlike levels of dynamic support or resistance or more subjective measurements such as Fibonacci retracements, pivot points, trendlines, or other forms of reactive areas, the horizontal lines of support and resistance are universal concepts used by the majority of market participants. It, therefore, makes the areas the most widely followed and relevant to monitor.
- Fundamentals: It’s important to highlight that the daily market outlook provided in this report is subject to the impact of the fundamental news. Any unexpected news may cause the price to behave erratically in the short term.
- Projection Targets: The usefulness of the 100% projection resides in the symmetry and harmonic relationships of market cycles. By drawing a 100% projection, you can anticipate the area in the chart where some type of pause and potential reversals in price is likely to occur, due to 1. The side in control of the cycle takes profits 2. Counter-trend positions are added by contrarian players 3. These are price points where limit orders are set by market-makers.
