
Recently, major investment bank The Goldman Sachs Group, Inc. (NYSE:GS) raised its oil price projection for 2018, giving a rosy picture for the commodity. The investment bank expects the global benchmark Brent crude to cross $80 per barrel this year on growing oil demand and the extension of the agreement between OPEC countries and Russia to limit production.
In January, JPMorgan Chase & Co. (NYSE:JPM) analysts raised their price forecasts for oil for the current year. The banking major believes that Brent crude will touch $70 a barrel while U.S. crude will average $65.63 a barrel in 2018. This increase in projections is based on the assumption that global demand for energy will rise substantially over the current year.
Additionally, for Q4 as a whole, earnings improvement is expected to be positive for the energy sector with double-digit growth. Earnings growth for energy is the highest among all sectors, with total earnings expected to be up 150.1% from the same period last year on 23.1% higher revenues. (Read More: Standout Features of the Q4 Earnings Season)
With TransCanada Corporation (TO:TRP) and Enbridge Inc. (NYSE:ENB) scheduled to report on Feb 15 and Feb 16, respectively, this may be a good time to consider which of these is a better stock. Both the energy infrastructure companies possess a Zacks Rank #3 (Hold). You can see the complete list of today’s Zacks #1 Rank (Strong Buy) stocks here.
Other major stocks reporting earnings from Feb 12 to Feb 16 include Cisco Systems, Inc. (NASDAQ:CSCO) and The Coca-Cola Company (NYSE:KO) .
Price Performance
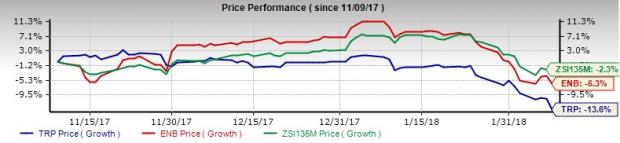
When considering price performance over the last three months, TransCanada has lost 13.6%, a lot worse than the broader industry’s 2.3% decrease. On the other hand, Enbridge has lost only 6.3% over this period.
Current Ratio
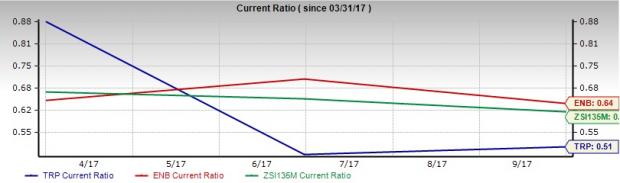
This metric measures the ability of a company to meet its short-term debt obligations efficiently. In other words, it is the ratio of the current level of total assets and versus the current level of liabilities. Here, Enbridge is a clear winner with a current ratio of 0.64, which is superior to TransCanada’s reading of 0.51.
Debt-to-Equity Ratio
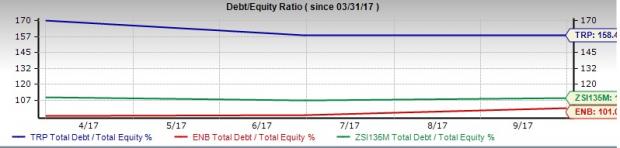
The debt-to-equity ratio is a good indicator of the financial well-being of a company and is a good proxy for its debt-servicing capacity. In the context of the oil and gas pipeline industry, which bears a high level of debt, it is an indicator of the company’s long-term sustainability. TransCanada has a debt-to-equity ratio of 158.4, while the industry has debt-to-equity ratio of 108.5. In contrast, with a debt-to-equity ratio of 101.03 Enbridge wins this round.
Dividend Yield
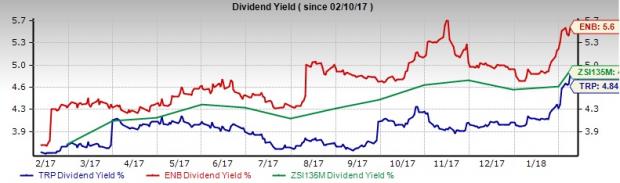
In the last one-year period, the industry had an average dividend yield of 4.86%, higher than 4.84% for TransCanada. However, Enbridge has an average dividend yield of 5.6%, better than both the industry and its peer TransCanada. So Enbridgeshareholders have more reasons to cheer.
Valuation
EV/EBITDA ratio is one of the best multiples for valuing oil and gas production and pipeline companies because these firms have a large amount of debt and EV (Enterprise Value). Compared with the S&P 500, the broader industry is undervalued. This implies that the industry has upside potential with an average trailing 12-month EV/EBITDA ratio of 16.27.
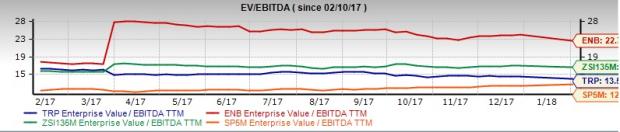
Enbridgethat has an EV/EBITDA ratioof 22.77 is overvalued than the industry. With an EV/EBITDA ratioof only 13.5 TransCanada is clearly less pricey than both Enbridge and the industry.
Earnings History, ESP and Estimate Revisions
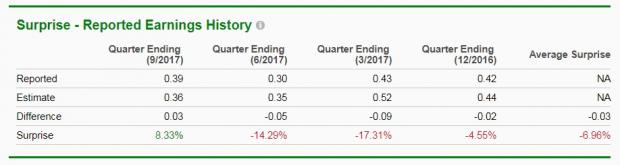
When considering the earnings history, TransCanada and Enbridgehave delivered negative average earnings surprises of -1.7% and -7%, respectively.
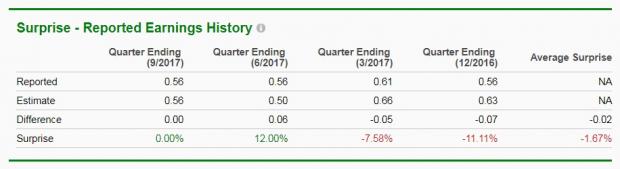
Both TransCanada and Enbridge missed their earnings estimate in the fourth quarter of 2016 and the first quarter of 2017. However, the earnings performance for both the companies has been similar over the second and third quarters of 2017. While TransCanada beat its earnings estimate in the second quarter of 2017, it managed to only meet the same in the third quarter of 2017. On the other hand, Enbridge beat its earnings estimate in the third quarter of 2017, even though it missed in the second.
Both Enbridge and TransCanada have a positive Earnings ESP. While this is a leading indicator of a positive surprise for the two, Enbridge’s ESP of +4.98% is more impressive than TransCanada’s +1.33%.
Conclusion
Our comparative analysis shows that TransCanada has an edge over Enbridge when considering EV/EBITDA ratios. However, when considering price performance, current ratio and debt-to-equity ratio Enbridge is a better stock than TransCanada. Additionally, Enbridge sports a better dividend yield than TransCanada and a more comprehensive look at the four-quarter earnings performance, places the former better too.
What clinches the case in favor of Enbridge at this point of time is that it has a better ESP than TransCanada. This is why it may be a good idea to bet on Enbridge over TransCanada as both prepare to report earnings over the next few days.
The Hottest Tech Mega-Trend of All
Last year, it generated $8 billion in global revenues. By 2020, it's predicted to blast through the roof to $47 billion. Famed investor Mark Cuban says it will produce "the world's first trillionaires," but that should still leave plenty of money for regular investors who make the right trades early.
See Zacks' 3 Best Stocks to Play This Trend >>
Cisco Systems, Inc. (CSCO): Free Stock Analysis Report
J P Morgan Chase & Co (JPM): Free Stock Analysis Report
Coca-Cola Company (The) (KO): Free Stock Analysis Report
Goldman Sachs Group, Inc. (The) (GS): Free Stock Analysis Report
Enbridge Inc (ENB): Free Stock Analysis Report
TransCanada Corporation (TRP): Free Stock Analysis Report
Original post
Zacks Investment Research