Stock market today: Nasdaq closes above 23,000 for first time as tech rebounds
- Monitoring purposes SPX: Covered short 10/13/16 at 2132.55 = gain 1.29%. Short SPX 10/5/16 at 2159.73.
- Monitoring purposes Gold: Covered GDX 10/6/16 at 22.88= gain 17.5%; Short GDX 9/22/16 at 27.75.
- Long-term trend monitor purposes: Short SPX on 1/13/16 at 1890.28

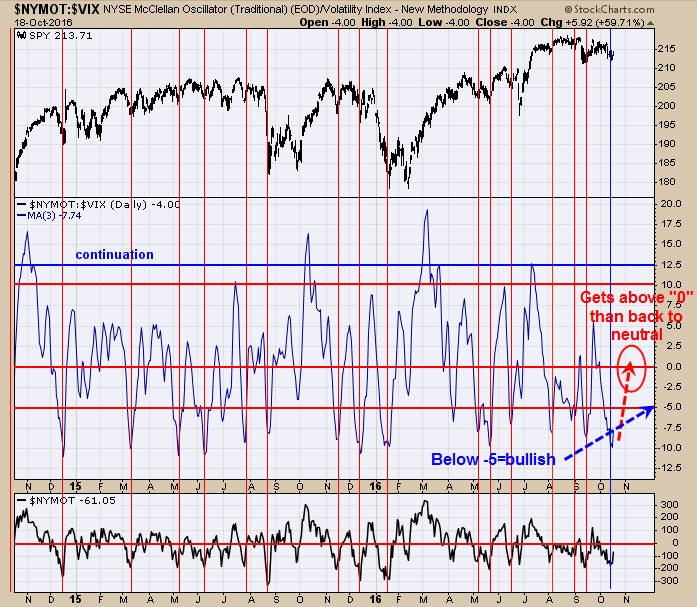
The short-term bounce during option expiration week appears not done. The middle chart above is our McClellan Oscillator/VIX ratio. Readings below -5 on this ratio has supported the SPDR S&P 500 (NYSE:SPY) and the current reading is -7.74. As you can see from the chart above, its rarely a good idea to look for a short position when this ratio is below -5. A short can be considered when this ratio gets above “0” with other indicators suggesting a top is nearing. Right now we don’t have signs that a top is forming; but that can change quickly. There is a gap near 216 on the SPY, which could be an upside target. On the last low we did not get panic in the TRIN but did so in the Ticks. We have had good success with buy signals when both reached panic levels and not so good success when only one (either trin or tick) reached panic levels. Therefore we will stay flat for now.

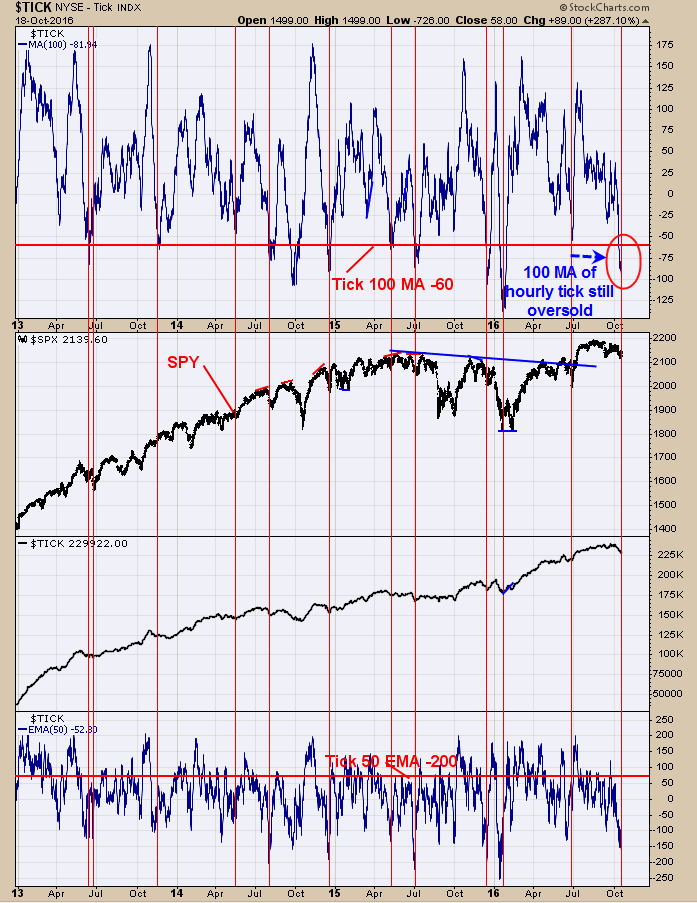
Market may push modestly higher short term. The top window is the 100-period moving average of the Tick and readings below -60 have provided support for the SPX. Current reading is -81.44. This is option expiration week which normally has a bullish bias and so far this expiration week this bullish bias may persist. Covered short SPX 10/13/16 at 2132.55; gain 1.26%; short SPX on 10/5/16 at 2159.73.”

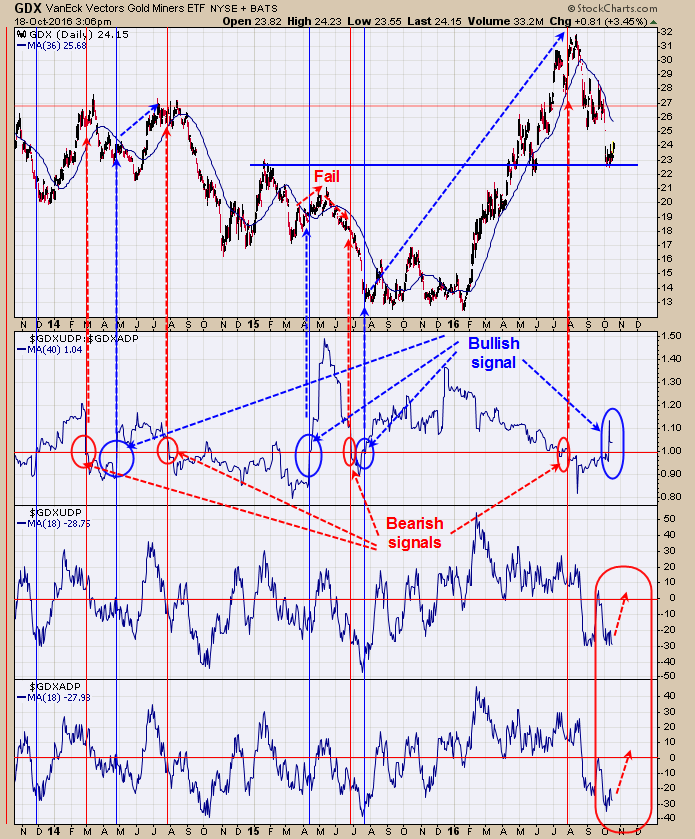
The middle window is the Up down Volume percent/Advance/Decline percent ratio. This ratio gives “head up” when a trend change is nearing. When this ratio falls below 1.00 it suggests market is topping and when rallies back above 1.00 it suggests a rally is forthcoming. The bearish signals seem to work well in time a top. For bottom signals, it seems to take awhile before the trend turns up. Though this ratio has closed above 1.00 (bullish) it could be another week or so before the rally actually starts. The when both the bottom two windows (Up down volume % and Advance/Decline %) close above “0” could indicate the rally in GDX has started.
Signals are provided as general information only and are not investment recommendations. You are responsible for your own investment decisions. Past performance does not guarantee future performance. Opinions are based on historical research and data believed reliable, there is no guarantee results will be profitable. Not responsible for errors or omissions. I may invest in the vehicles mentioned above.
Which stock should you buy in your very next trade?
AI computing powers are changing the stock market. Investing.com's ProPicks AI includes dozens of winning stock portfolios chosen by our advanced AI.
Year to date, 3 out of 4 global portfolios are beating their benchmark indexes, with 98% in the green. Our flagship Tech Titans strategy doubled the S&P 500 within 18 months, including notable winners like Super Micro Computer (+185%) and AppLovin (+157%).
Which stock will be the next to soar?
