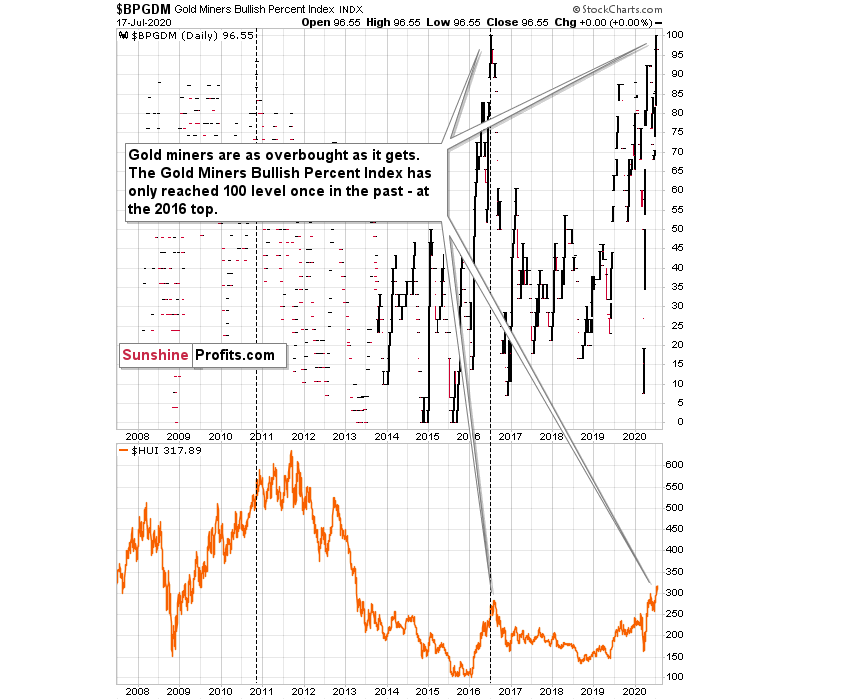
Last week, we wrote that gold miners flashed an "extremely overbought" signal, which they had only flashed once in the past - almost right at the 2016 top. The Gold Miners Bullish Percent Index recently moved to the highest level that it could reach - 100.
The only other case when the index was at 100, was in mid-2016.

We marked this situation with a vertical dashed line. Did miners continue to move higher for a long time, or did they move much higher? No.
Precisely, the index reached 100 on July 1st 2016, and gold mining stocks moved higher for two additional trading days. Then they topped. This was not the final top, but the second top took miners only about 5% above the initial July high.
This year, the index reached the 100 level on July 2nd - almost exactly 4 years later, and once again practically exactly in the middle of the year. Miners seemed to have formed the intraday high on July 9th - four trading days later.
It's not justified to assume that the delay in the exact top would be 100% identical, but it seems justified to view it as similar. Two-day delay then, and four-day delay now seem quite in tune, and this similarity supports a bearish prediction for gold.
There's also one additional point that we would like to emphasize and it's the previous high that the index made on November 9, 2010. That was the intraday top, so there was no additional delay. There was one additional high about a month later, in December, but miners moved only about 1.5% above the initial high then.
One might ask if mining stocks are really overbought right now given the unprecedented quantitative easing, and the answer is yes. Please note that in 2016 the world was also after three rounds of QE, which was also unprecedented, and it didn't prevent the miners to slide after becoming extremely overbought (with the index at the 100 level). The 100 level in the index reflects the excessive optimism, and markets will move from being extremely overbought to extremely oversold and vice versa regardless of how many QEs there are. People tend to go from the extreme fear to extreme greed and then the other way around, and no fundamental piece of news will change that in general. The economic circumstances change, but fear and greed remain embedded in human (and thus markets') behavior. Taking advantage of this cyclicality is the basis for most (if not all) gold trading tips and the same goes for other markets.
Today, we would like to dig deeper into the analogy to the 2016 top. There are more similarities than just the most-extreme reading from the Gold Miners Bullish Percent Index.
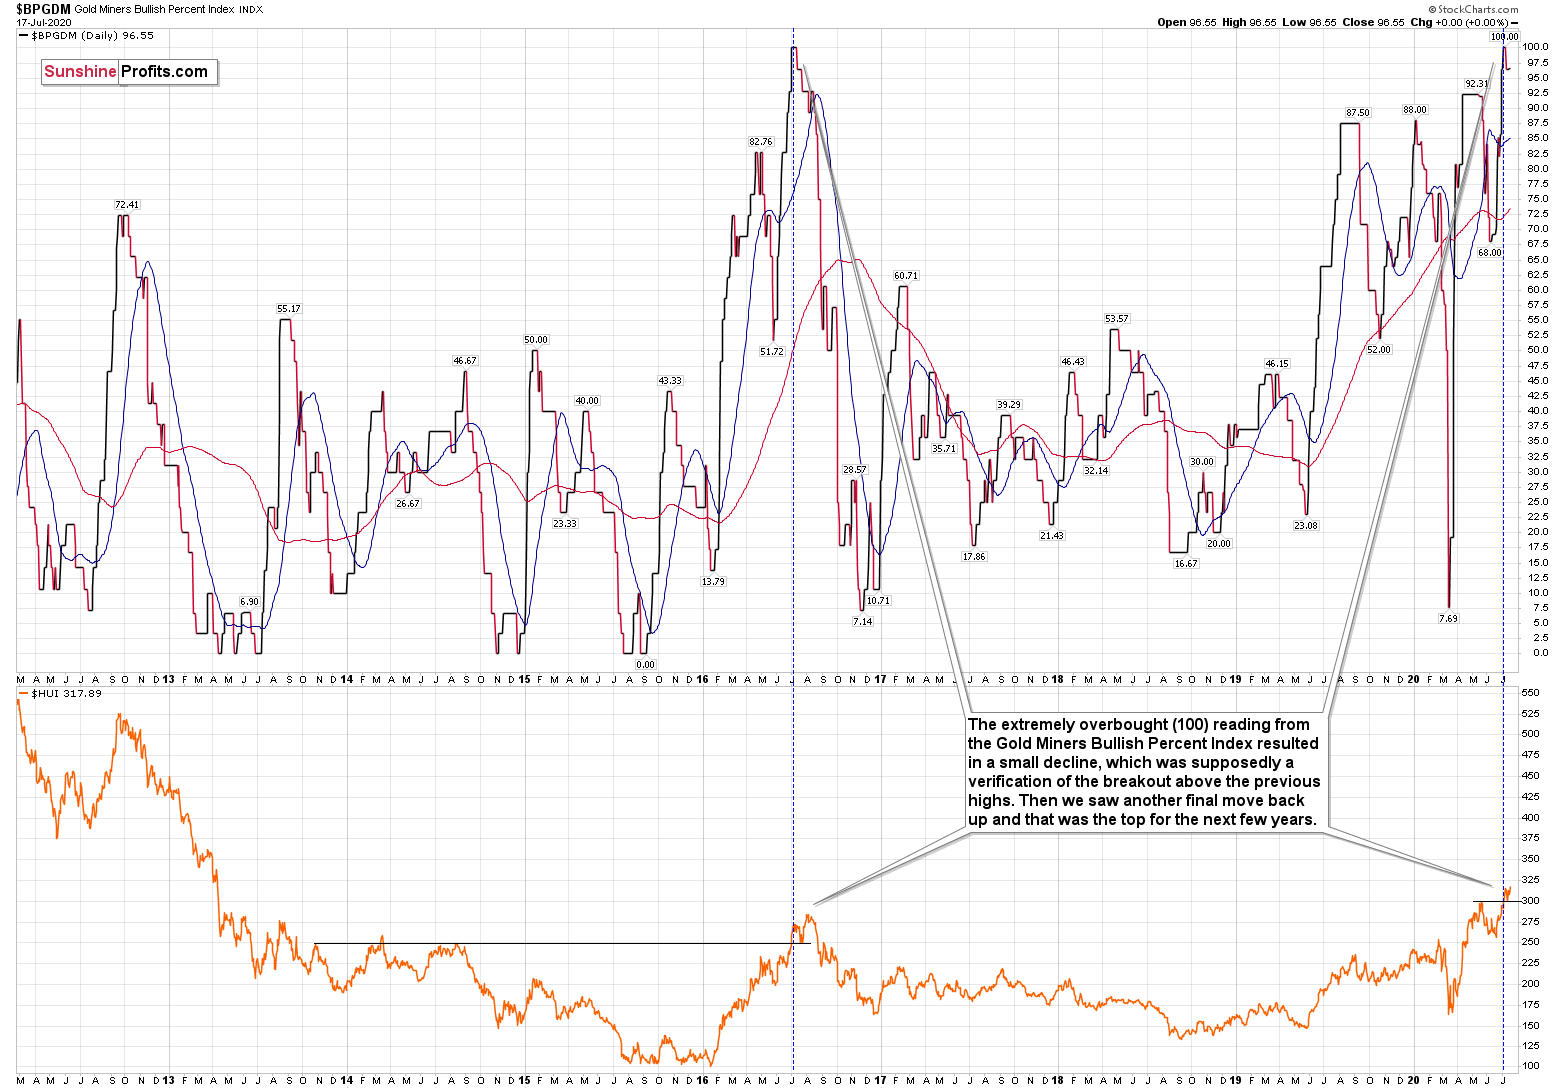
In order to do that, let's zoom in.

Back in 2016, the extremely overbought (100) reading from the Gold Miners Bullish Percent Index resulted in a small decline, which was supposedly a verification of the breakout above the previous (2013 and 2014) highs. Then we saw another final move back up and that was the top for the next few years.
What happened recently? The extremely overbought reading resulted in a decline back to the previous 2020 high and then another move higher. This is very similar to what we saw in 2016.
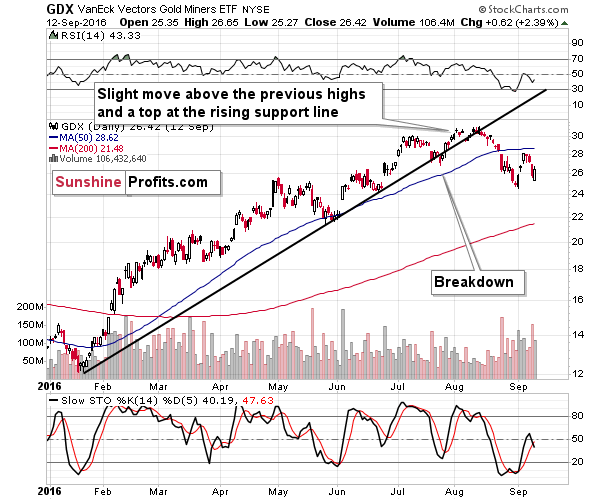
What happened in the GDX (NYSE:GDX) ETF with regard to its own technical indications?

Well, shortly after the extremely-overbought reading, the GDX ETF moved lower and broke below the rising medium-term support line. It then moved back up and topped slightly above the previous highs. When the rising support line was more or less at the same price level as the previous high, GDX broke below it and formed a top that was not exceeded for a few years.
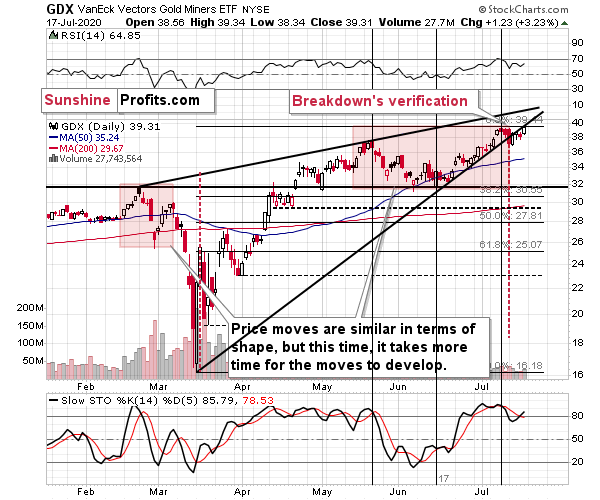
And what happened recently in the GDX?

Pretty much the same thing. Shortly after we saw the extreme (100) reading from the Gold Miners Bullish Percent Index, GDX broke below its rising medium-term support line. It then moved back up, and while it didn't move to new intraday highs, Friday's closing price was slightly above the previous 2020 high.
The rising medium-term support line just moved to the previous high as well.
The history has been repeating to a very considerable (quite remarkable) extent, and if it continues to do so - which seems likely - we're likely to see a sizable decline shortly. In fact, Friday's high might have been the high for the next few months. If not, then such a high is very likely to form this week.
