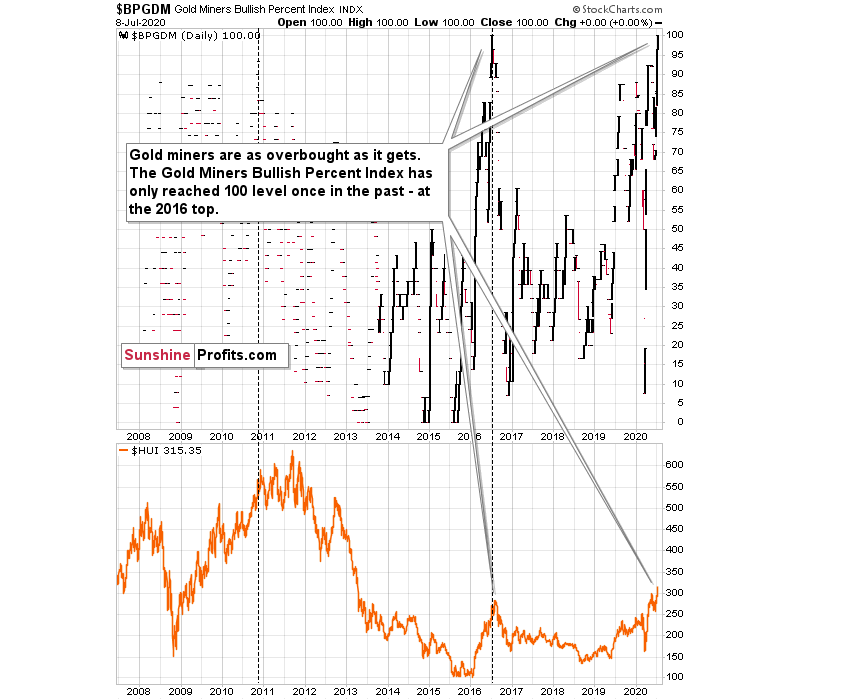
We'll started today’s Gold & Silver Trading Alert with the Gold Miners Bullish Percent Index. We’ll do so, because we received a question about whether gold miners stayed overbought for a long time, while they kept pushing to new highs – just like what markets sometimes do (especially the general stock market) when a given indicator (say, RSI) is already overbought.
In short, no.

The only other case when the index was at 100, was in mid-2016. We marked this situation with a vertical dashed line. Did miners continue to move higher for a long time, or did they move much higher?
No.
Precisely, the index reached 100 on July 1, 2016, and gold mining stocks moved higher for two additional trading days. Then they topped. This was not the final top, but the second top took miners only about 5% above the initial July high.
This year, the index reached the 100 level on July 2 – almost exactly four years later and, once again, practically exactly in the middle of the year. Yesterday was the third day after this move. It’s not justified to assume that the delay in the exact top would be 100% identical, but it seems justified to view it as similar. Two-day delay then, and three-day delay now seem quite in tune.
There’s also one additional case that we would like to emphasize and it’s the previous high that the index made on Nov. 9, 2010. That was the intraday top, so there was no additional delay. There was one additional high about a month later, in December, but miners moved only about 1.5% above the initial high then.
One might ask if mining stocks are really overbought right now given the unprecedented quantitative easing, and the answer is yes. Please note that in 2016 the world was also after three rounds of QE, which was also unprecedented, and it didn’t prevent the miners to slide after becoming extremely overbought (with the index at the 100 level). The 100 level in the index reflects the excessive optimism, and markets will move from being extremely overbought to extremely oversold and vice-versa regardless of how many QEs there are.
People tend to go from the extreme fear to extreme greed and then in the other way around, and no fundamental piece of news will change that in general. The economic circumstances change, but fear and greed remain embedded in human (and thus markets’) behavior.
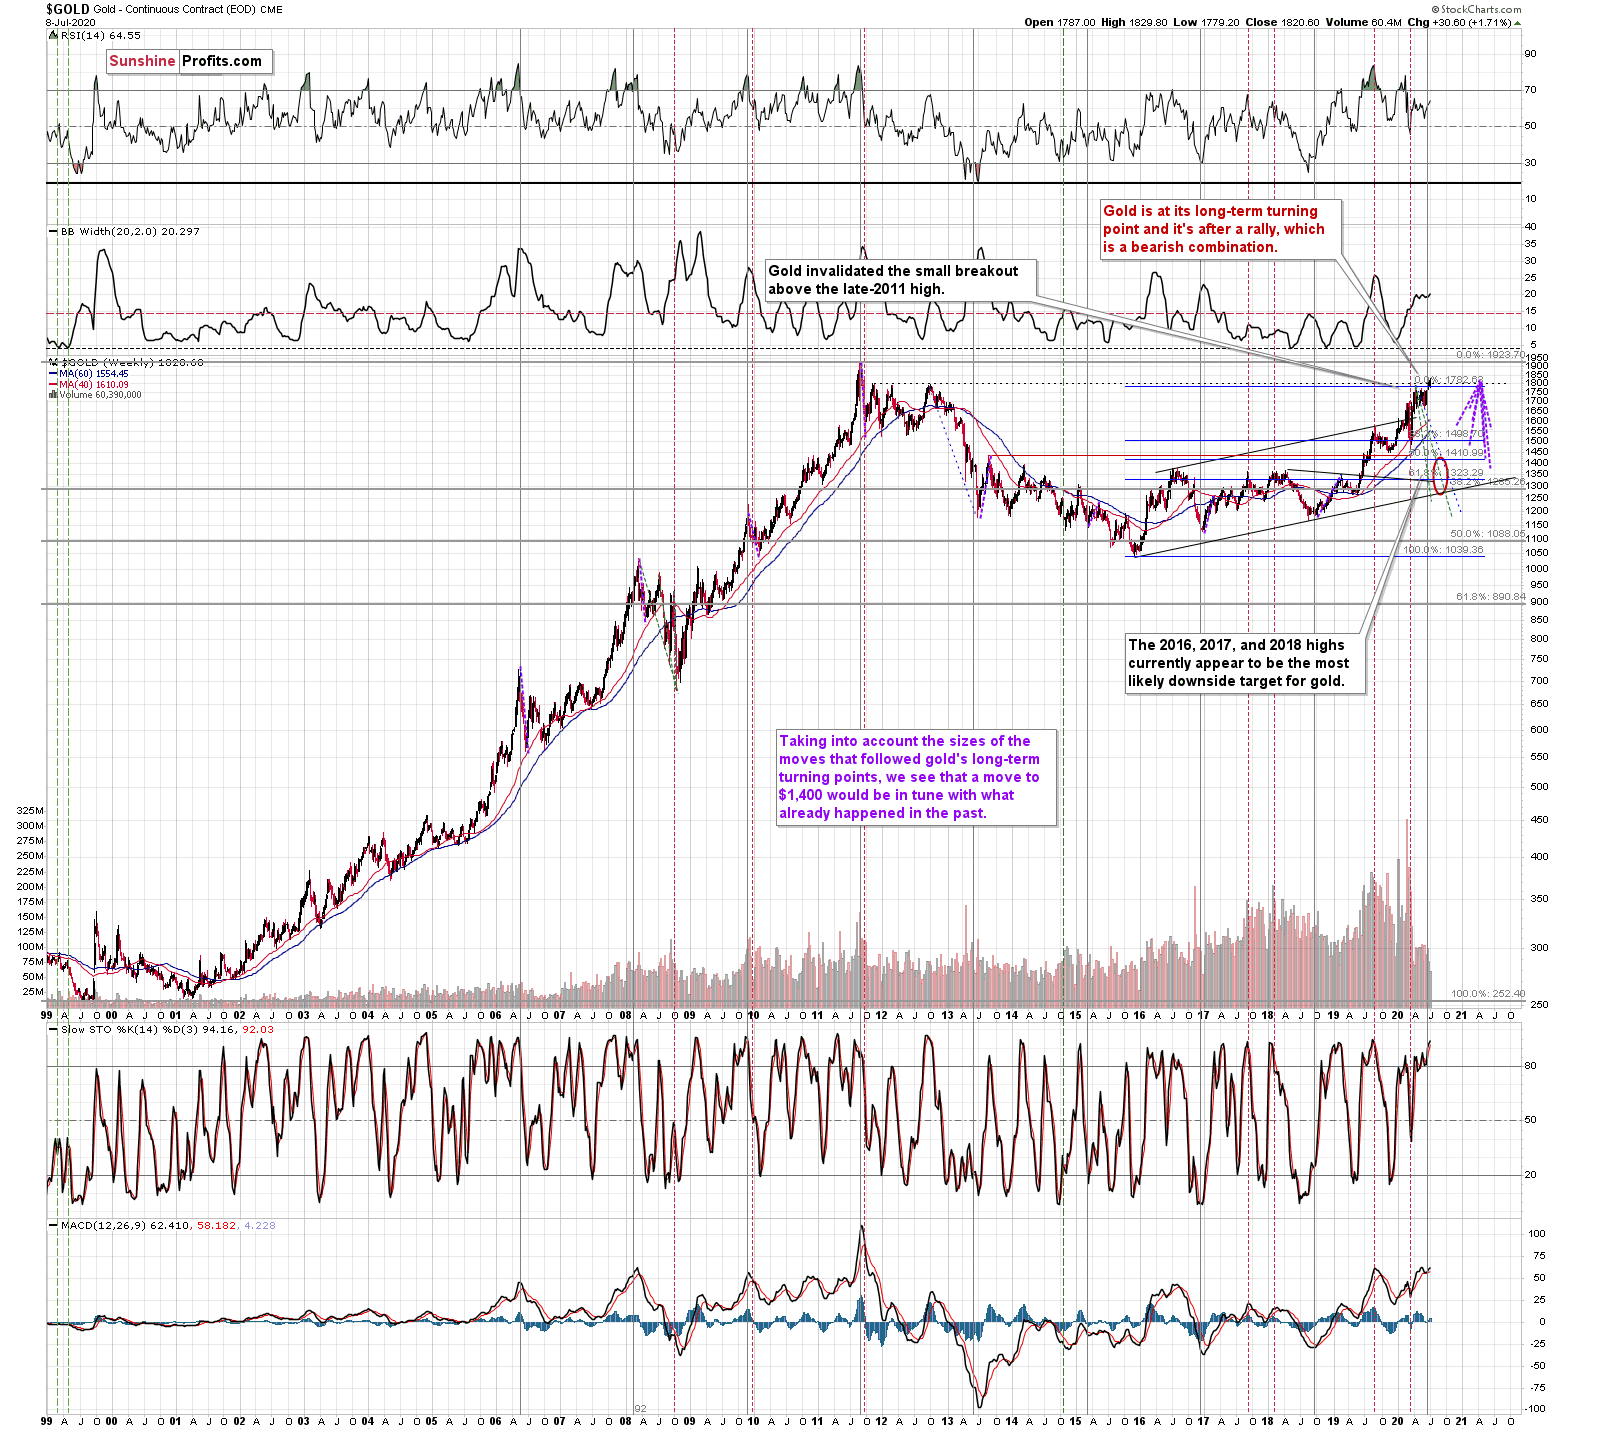
It’s unlikely that gold miners would wait as long before declining profoundly, or that there would be another move higher before the bigger decline. Why? We already wrote about that this week – for instance, because of gold’s long-term turning point and because of USD’s mid-year turning point:

Gold's very long-term turning point is here and since the most recent move was to the upside, the implications are bearish. They are particularly bearish since gold just invalidated the tiny breakout above its November 2011 high.
Naturally, everyone's trading falls within their responsibility, but in our opinion, if there ever was a time to either enter a short position in the miners or to increase its size if it wasn't already sizable, it&'s now. We made money on the March decline and on the March rebound (buying miners on March 13th), and it seems that another massive slide is about to start.
When everyone is on one side of the boat, it's a good idea to be on the other side, and the Gold Miners Bullish Percent Index literally indicates that this is the case with mining stocks.
We used the purple lines to mark the previous price moves that followed gold’s long-term turning points, and we copied them to the current situation. We copied both the rallies and declines, which is why it seems that some moves would suggest that gold moves back in time – the point is to show how important the turning point is in general.
The take-away is that the long-term turning point is a big deal, and that gold could fall significantly before it soars due to its extremely positive fundamental outlook. This also means that the downside target of $1,400 or slightly lower (the 2016 – 2018 highs) is well within the range of the possible moves.
