Sometimes it can be useful to step back from focusing on the specifics of a single market to think about the relative performance of sectors globally and how macro conditions affect each region. In a lot of cases, the relative performance of American and European sectors to their markets track each other closely and their divergence can yield insights about either opportunity or macro differences between economic blocs.
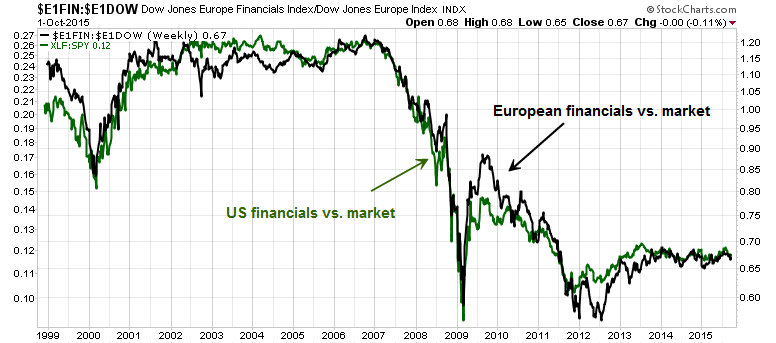
For example, below is a chart of the relative performance of financial stocks (via SPDR S&P 500 (NYSE:SPY and Financial Select Sector SPDR (NYSE:XLF) for the US and Dow Jones Europe Financials and Dow Jones Europe for Europe) on both sides of the Atlantic. They are highly correlated and there are no special insights to be gained here.
An opportunity in European Energy
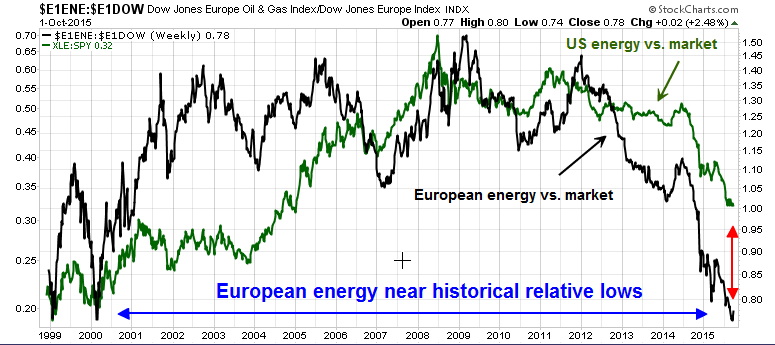
By contrast, a relative performance gap has opened up between US (Energy Select Sector SPDR (NYSE:XLE)) and European (Dow Jones Europe Oil & Gas) Energy stocks. European energy stocks have far underperformed US energy on a relative basis and they are sitting near all-time relative performance lows stretching back 18 years.
On a cap weighted basis, the characteristics of the European and US sectors are fairly similar. The European Energy sector is dominated by mostly megacap integrated companies, e.g. Royal Dutch (NYSE:RDSa), Total (NYSE:TOT), etc., while smaller names include the likes of ENI (NYSE:E)) and Repsol (OTC:REPYY) - all of which are well diversified integrateds. By contrast, the US has far higher higher beta exploration and oil service companies in its energy universe.
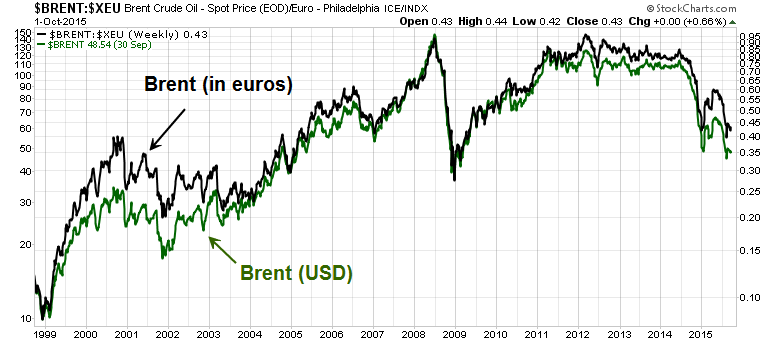
As oil prices have cratered, it makes no sense that European large cap integrated oils should underperform more than American ones, especially when you consider that the price of Brent has performed better in euros than USD.
This pricing gap suggests a couple of opportunistic trades:
- Buy European large cap energy and short US large cap integrated energy
- Buy a long Europe Energy/European market pair, while short US Energy/US market pair
Unfortunately, there are no US listed ETFs through which American investors can readily get easy exposure to European energy stocks. The alternatives are either a European listed ETF (example here), or create a custom basket of US-listed European energy stocks, all of which have US listings.
Is the Healthcare sell-off overdone?
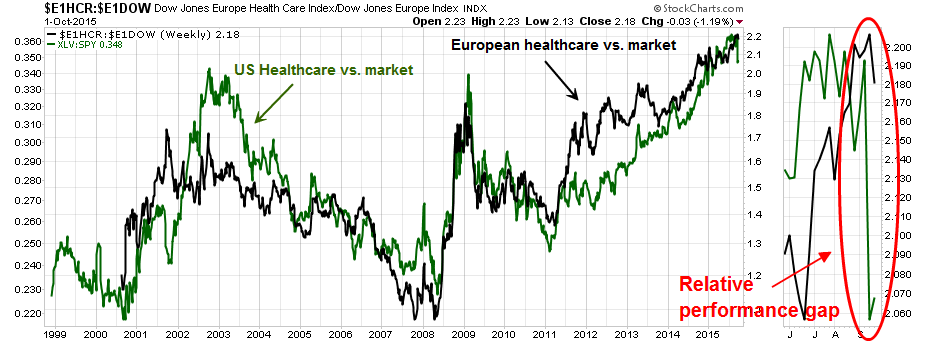
By contrast, there seems to be a different kind of opportunity in Healthcare. The chart below shows that Healthcare stocks (read: Big Pharma - via Health Care Select Sector SPDR (NYSE:XLV) and Dow Jones Europe Health Care) have tracked each other fairly well across the Atlantic for many years. Undoubtedly that can be attributed to the fact that the pharmaceutical business is a global business and these companies sell their products worldwide.
What the chart does show is that while US Healthcare stocks have weakened significantly relative to the S&P 500 recently, their European counterparts have held up quite well. It could be argued that the sell-off could be attributed to a Hillary Clinton comment on drug pricing. If that were true, then shouldn't European drug companies that sell into the American market suffer equally?
This relative performance anomaly is therefore suggesting a relative bargain in US Healthcare stocks.
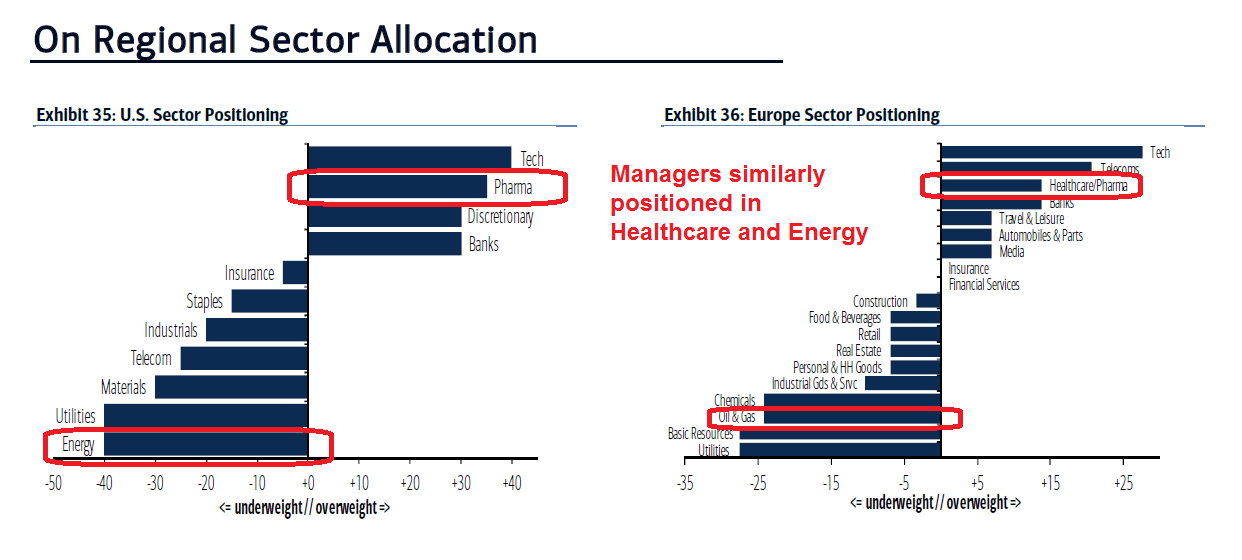
What I find equally intriguing is that a review of the latest BoAML Fund Manager Survey shows that institutional managers have roughly the same levels of relative exposure to both Energy and Healthcare. When I combine the FMS results with the relative pricing anomalies, it suggests that there are Trans-Atlantic opportunities for traders in these two sectors.
Disclosure: Cam Hui is a portfolio manager at Qwest Investment Fund Management Ltd. ("Qwest"). This article is prepared by Mr. Hui as an outside business activity. As such, Qwest does not review or approve materials presented herein. The opinions and any recommendations expressed in this blog are those of the author and do not reflect the opinions or recommendations of Qwest.
None of the information or opinions expressed in this blog constitutes a solicitation for the purchase or sale of any security or other instrument. Nothing in this article constitutes investment advice and any recommendations that may be contained herein have not been based upon a consideration of the investment objectives, financial situation or particular needs of any specific recipient. Any purchase or sale activity in any securities or other instrument should be based upon your own analysis and conclusions. Past performance is not indicative of future results. Either Qwest or Mr. Hui may hold or control long or short positions in the securities or instruments mentioned.

