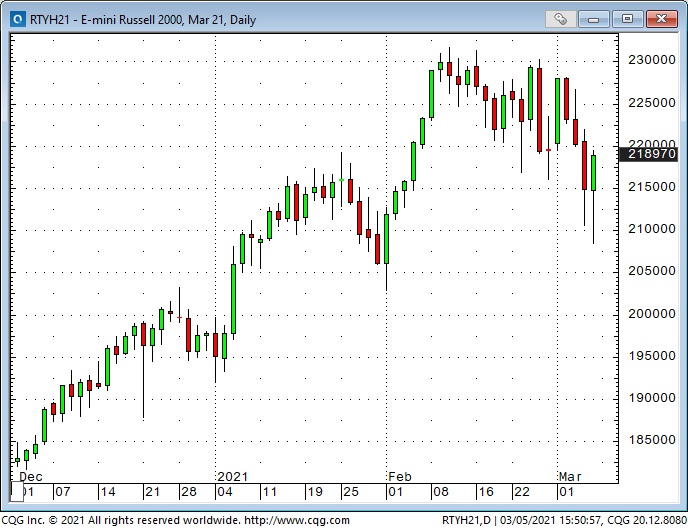
Speculative excesses peaked in February and markets have been in a correction phase. Time for a bounce?
The stock market rally from the March 2020 panic lows paused in September/October, but then resumed with a vengeance following the November election and the Pfizer (NYSE:PFE) vaccine announcement.
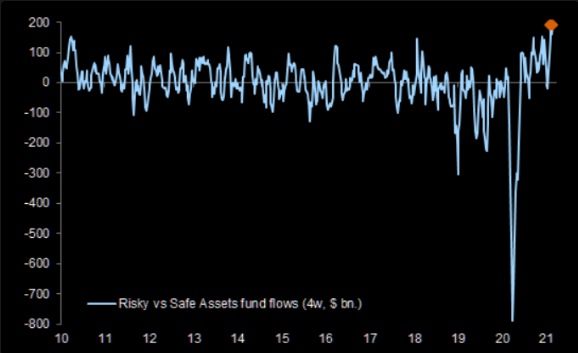
Tech was the initial go-to favorite, especially BIG CAP tech, but ESG was also embraced. A “rotation” to small caps started in November as folks jumped on the reflation/re-opening bandwagon. The intensity of the Bullish Enthusiasm spread so widely that it became known as the Everything Rally. A torrent of capital flowed into stock markets around the world. It became FOMO on steroids!
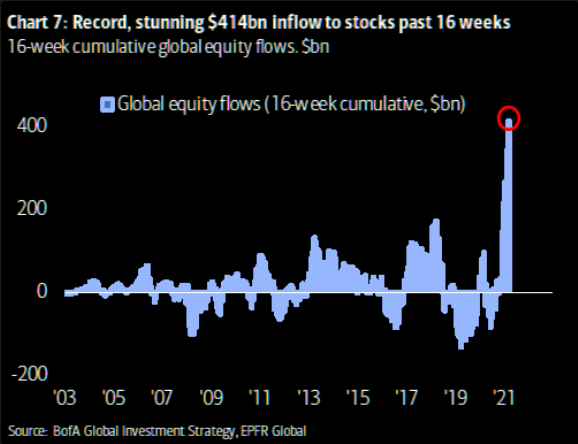
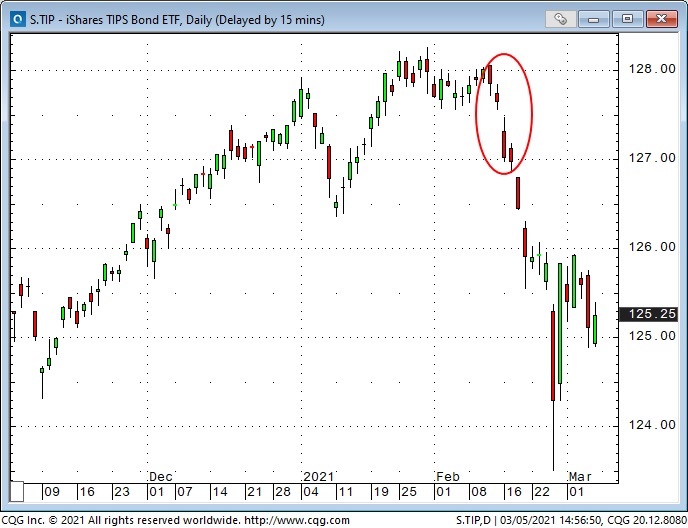
Bullish enthusiasm was so intense and so widespread that you knew there was going to be a correction. Interest rates surged higher in mid-February (bond prices dropped) and Invesco QQQ Trust (NASDAQ:QQQ) dropped ~12% from Feb. 16 to Friday’s low (Mar. 5).
10-year US Treasury yields
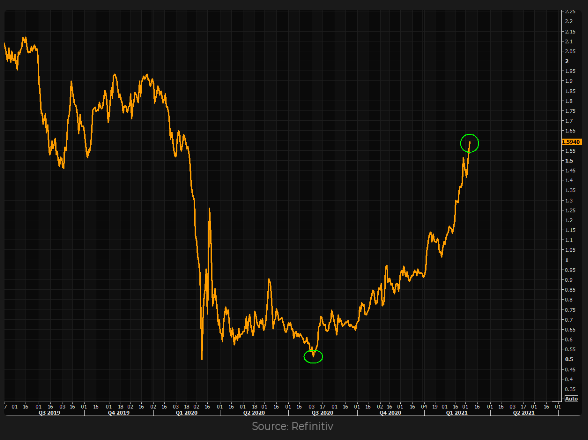
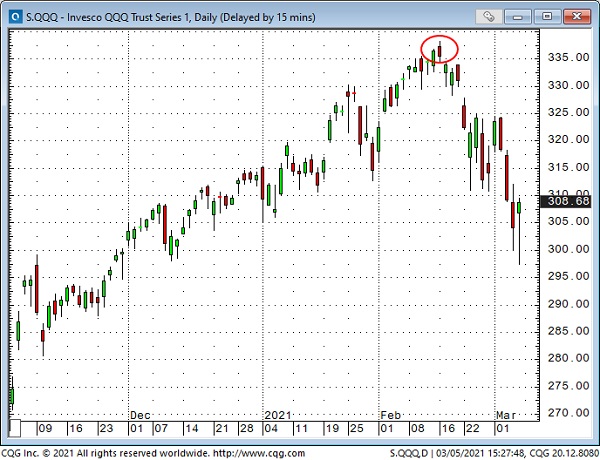
Rising interest rates—like for the 10-year Treasury note—may have been the trigger for the correction, but many analysts had been warning that “conditions were ripe” for a correction.
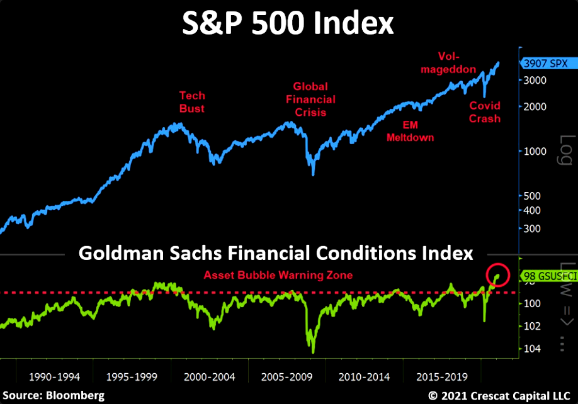
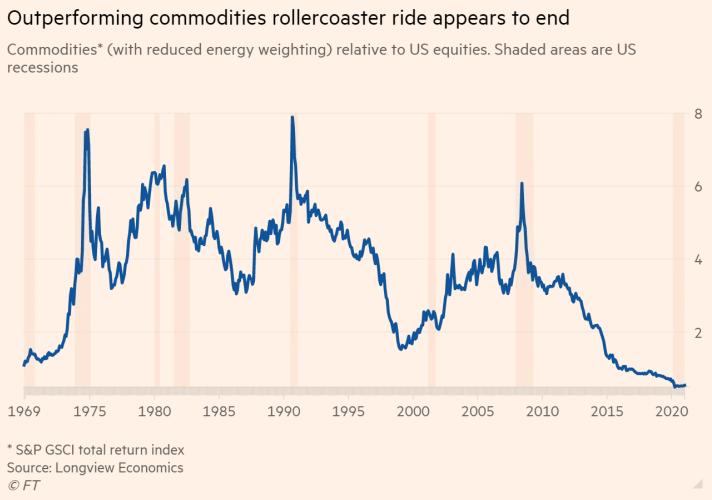
Bullish enthusiasm also embraced the commodity markets, which were astonishingly cheap compared to equities.
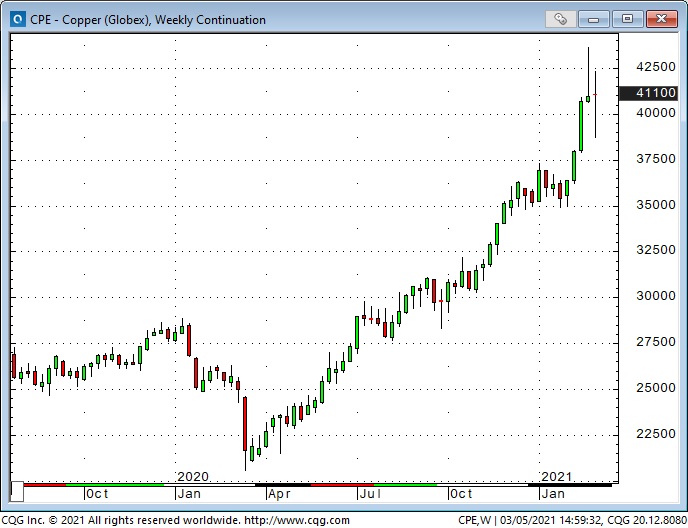
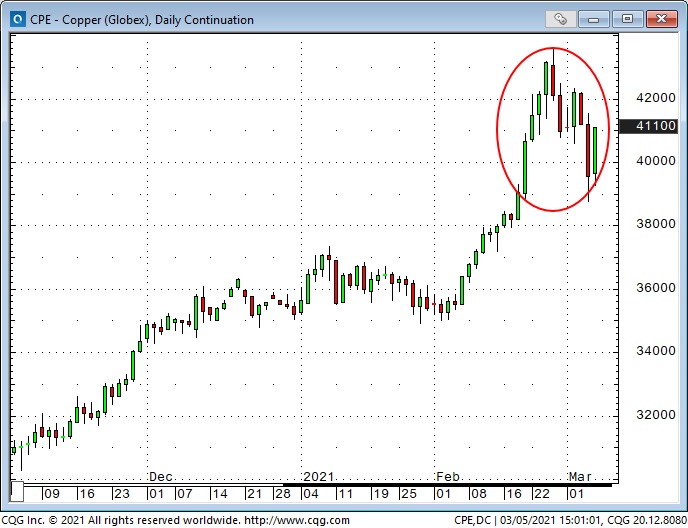
Copper more than doubled in price from it’s March 2020 lows, with an incredible surge in February taking it to 10-year highs—before a sharp correction began.
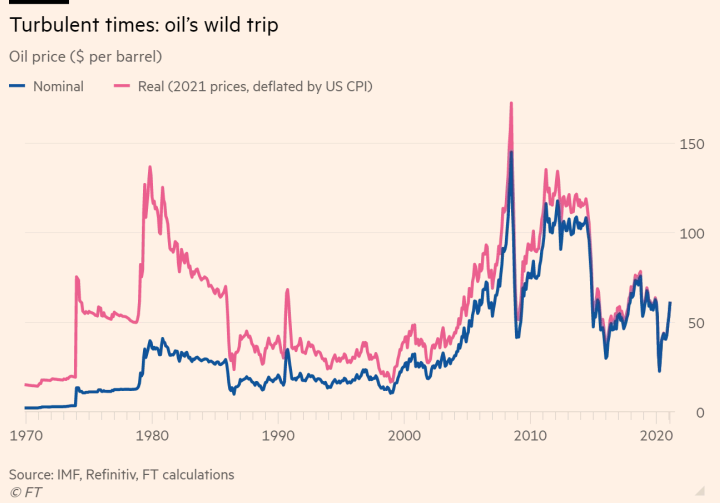
WTI crude oil briefly traded at negative prices in April 2020, but nearly doubled from the ~$34 November low to last week’s high of ~$66. This long-term chart helps put current prices in perspective. (And yes, oil prices really were $1 to $2 back in the early 1970s and $147 in July 2008!)
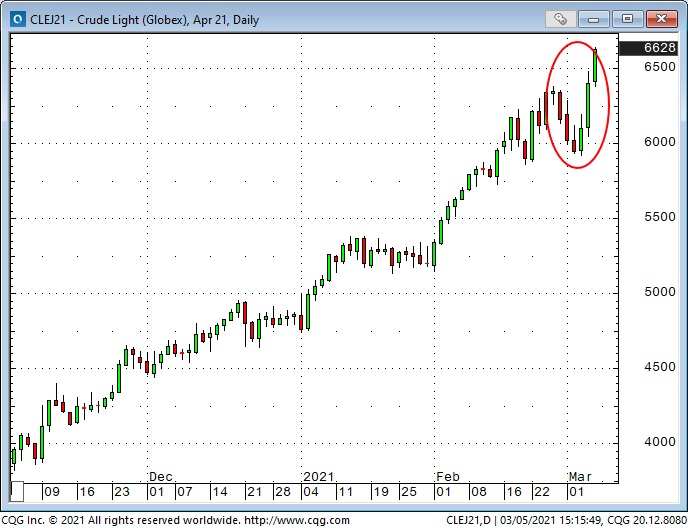
Crude began to correct from the previous week’s highs early last week but jumped ~$7 from Wednesday’s low to Friday’s high following OPEC’s surprise decision to only increase production by 150,000 bpd.
Currencies
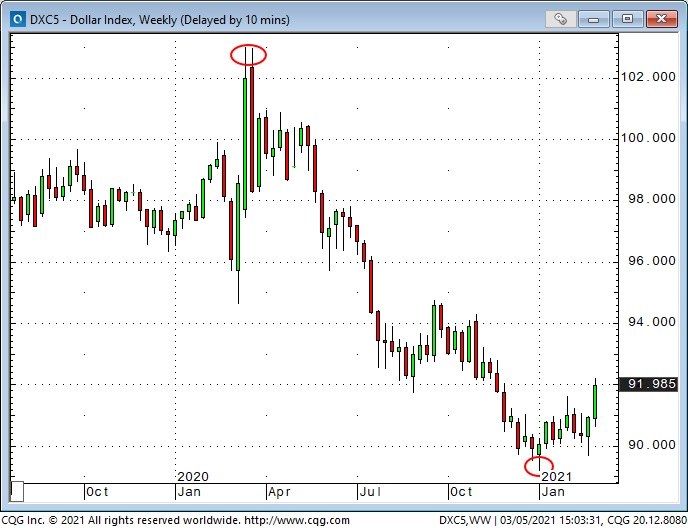
The US dollar was panic-bid to 3-year highs last March but then trended lower until the Jan. 6 (storming of the Capital Building) inflection point. Sentiment and positioning has remained very bearish on the USD even as it has rallied off the January lows. If the USD continues higher, I think it will benefit from a short-covering boost.
The commodity currencies
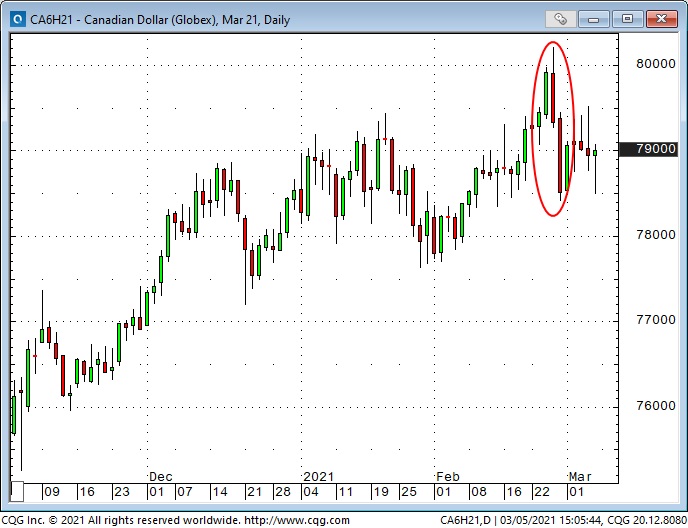
The US Dollar Index rallied to a 3 month high from its January low but the gains came mostly at the expense of the euro and Japanese yen. The “Com-Dols” (CAD, AUD, NZD) continued to rally into February in sync with the broad commodity indices, until the previous week when “commodities” began their own overdue correction.
The Chinese currency
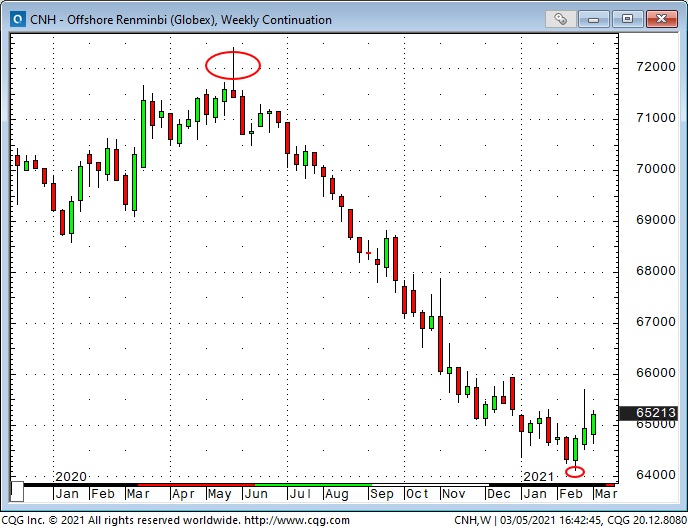
The Offshore Renminbi climbed relentlessly against the USD (lower prices in this chart means it takes fewer RMB to buy one USD from May 2020 until Feb. 16–the day the NASDAQ peaked and US interest rates began to surge higher. The change in trend has been modest since then and may simply reflect the narrowing of interest rate differentials between the USA and China, but it could also signal broader USD strength.
Gold remains under pressure
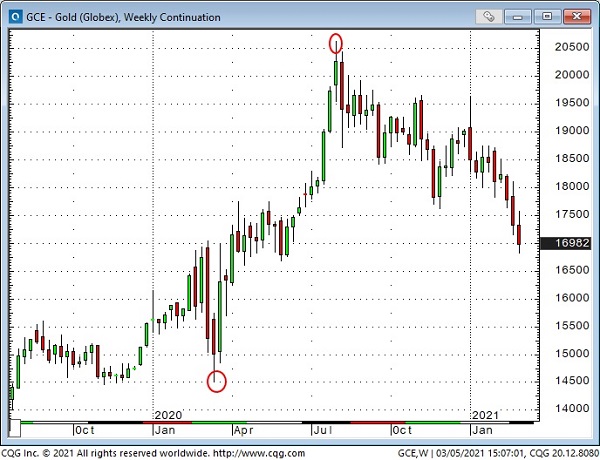
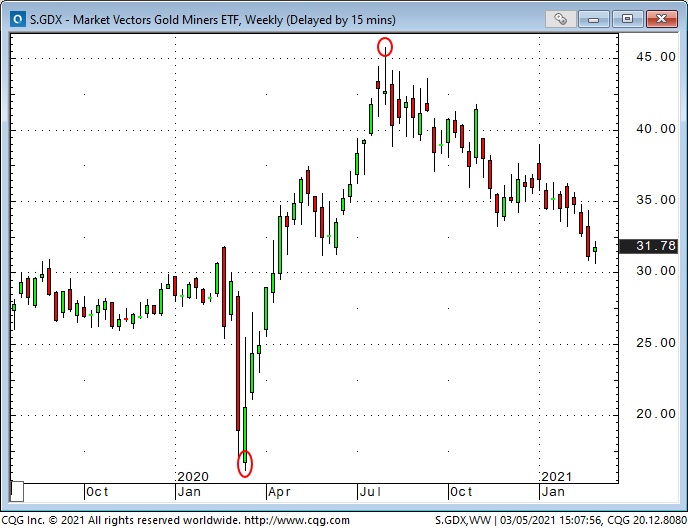
Gold soared to All Time Highs above $2,100 in August last year but fell ~$425 (~20%) to last week’s low. VanEck Vectors Gold Miners ETF (NYSE:GDX), the gold miner ETF, is down ~33% in the same time period.
Gold is a puzzle. Given inflation concerns, currency debasement concerns and soaring commodity markets I thought gold would rally. I can’t believe its all about people deserting gold for cryptocurrencies. Maybe I’m wrong about that.
I have previously written that gold ETF buying was a HUGE part of last year’s rally, but since last Fall there has been net selling of gold ETFs (even though total gold ETF holdings remain historically very high.) Comex open interest has been dwindling. Perhaps people have simply lost interest in gold, for now.
My short term trading
From the perspective of trading “market psychology” I’ve been anticipating a “break” in the relentless Bullish Enthusiasm across markets that has seen people rewarded for taking more-and-more risk. I’ve been shorting “irrational exuberance,” which means I’ve taken short positions in stock indices, commodities and commodity currencies.
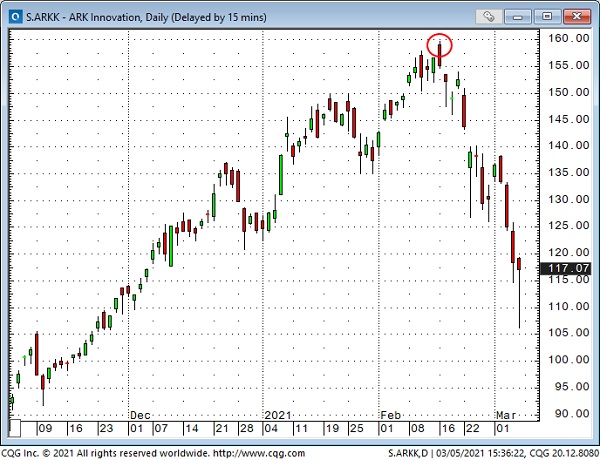
I trade futures and futures options exclusively but I watch many individual stocks to get a “feel” for market psychology. ARK Innovation ETF (NYSE:ARKK) has been a market darling (with ~10% allocation to Tesla (NASDAQ:TSLA)) and it had massive capital inflows. It peaked on Feb. 16, which was a turning point for market psychology in a number of markets.
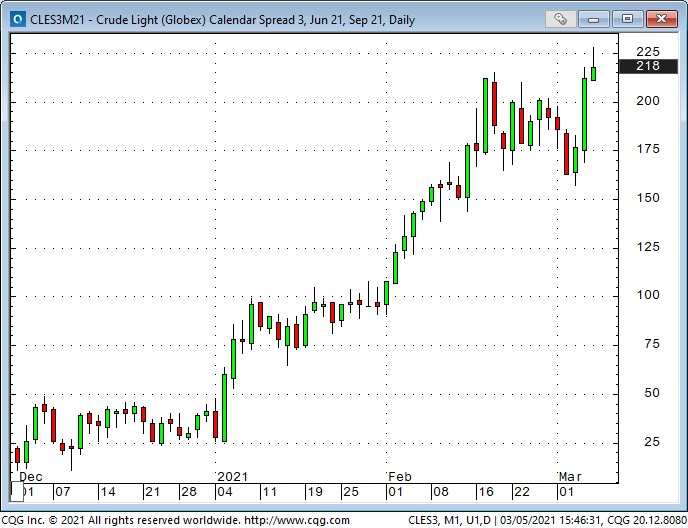
The only position I carried over from the previous week into last week was a bearish WTI calendar spread. I expected WTI to fall but rather than short WTI outright I sold June/bought September expecting the premium of June over September to narrow.
The spread dropped further in my favor Monday and Tuesday. I lowered my stop to a breakeven and was stopped early Thursday when WTI surged higher on OPEC’s production limits.
I shorted the CAD again this week, but was stopped twice for small losses.
I made money shorting stock indices mid-week but did a full 180-degree turn Friday and got long the small cap Russell when all of the major stock indices reversed off intra-day lows. The indices had sold off sharply Tuesday through Thursday and were even lower early Friday. I don’t know if the “correction” is over but Friday’s powerful rally sets up a possible strong opening Monday morning.
