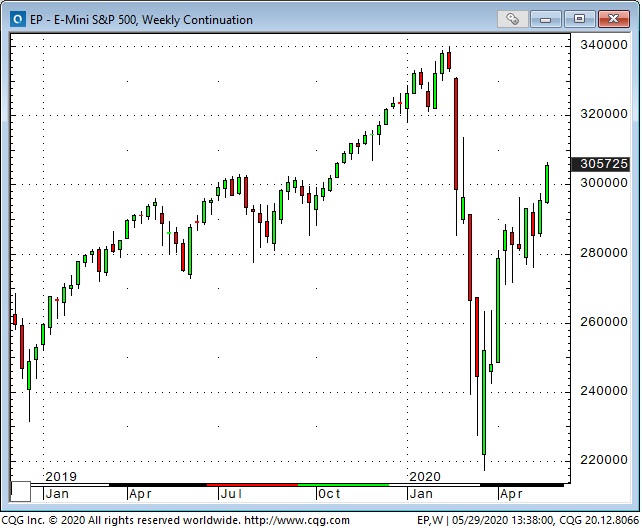
My bias is that the 20% rally in the S&P 500 from October 2019 to February 2020 may have been a “blow-off top” to a 10 year bull market. (I see Tesla (NASDAQ:TSLA) running from ~$250 to ~$950 as the poster child for the Irrational Exuberance of that time.) The virus set off a “tumbling dominos” decline from the February All-Time Highs to the March lows...massive stimulus in late March sparked a sharp rally that may now be vulnerable to rolling over.
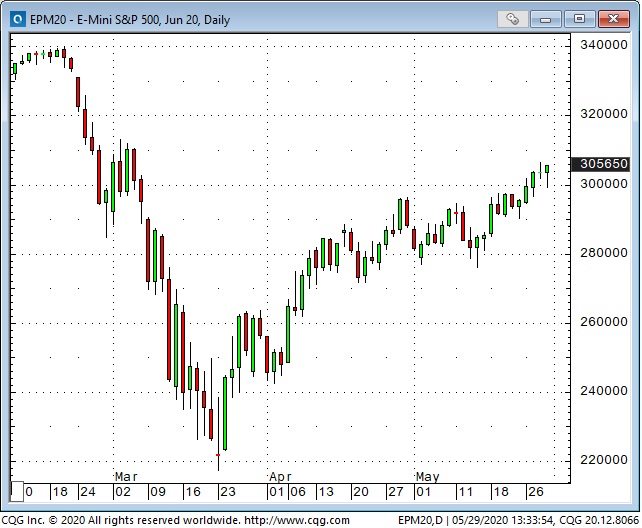
The growing divergence between the “stock market” and the economy the past couple of months maybe a warning flag that Mr. Market is too exuberant. The Presidential election is just over 5 months away with polls showing that Biden may be the next President. US/China tensions have been escalating and the first wave of the virus continues to spread around the globe...but the “stock market” continues to be pulled higher by a handful of Big Names...and the late Friday rally after Trump’s “punish China” speech shows that “animal spirits” are alive and well!
You have to wonder who’s been buying. Stock mutual funds have seen net cash outflows. Institutional surveys show that they aren’t buying. Druckenmiller and Buffet aren’t buying. Maybe foreigners are buying (Saudi SWF etc.) as American indices continue to outperform the ROW. Maybe “hedge funds” have been covering shorts. Millions of new retail online accounts seem to be buying with both fists...they will probably buy the first dip...but if the market keeps falling they will likely turn sellers.
My Number One job as a trader is to protect my capital...both financial and mental. My biases may get me into a losing trade but my risk management has to ensure that a small loss doesn’t grow into a big one...that a trade is “only a trade.” My biases may get me into a trade “too early” but my risk management has to ensure that my initial size is small, stops are tight and that I never add to a losing position.
My P+L is down 1 – 2% this month because I traded stock indices and currencies on the expectation that “risk on” would morph into “risk off.” So far that hasn’t happened. My biases probably got me into some trades “in anticipation” of follow through...my risk management kept my losses small when that didn’t happen.
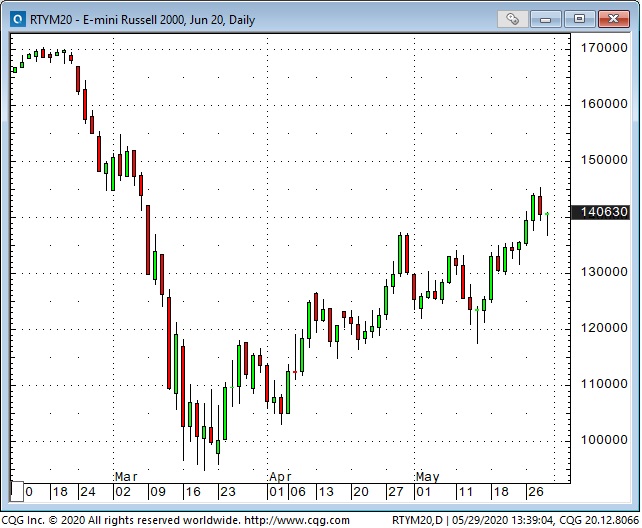
When I wanted to short “the stock market” I used the Russell 2000 index as it has been the overall weakest of the major indices over the past couple of years. I’ve sold it when it seemed over-extended and I’ve sold it when it “broke down.” I seemed to do better selling it when it was over-extended...the “break-downs” seemed to quickly reverse.
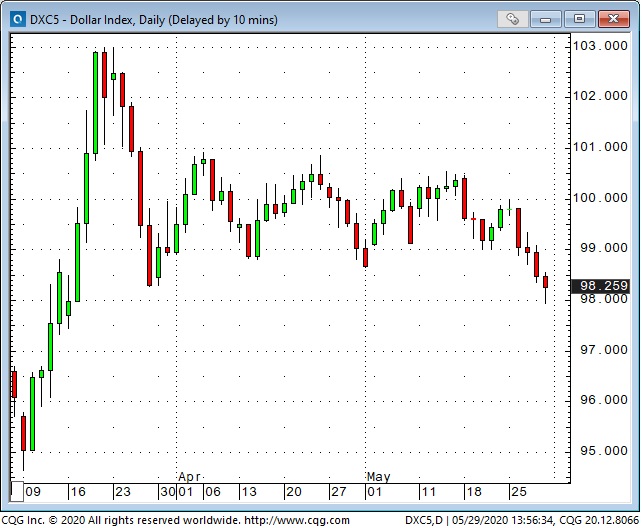
The US Dollar index fell to a 2 ½ month low this week...it has generally been weak in a “risk on” environment, strong in a “risk off” environment. Emerging market currencies were especially weak in a “risk off” environment...and have been especially strong in the recent “risk on” environment.
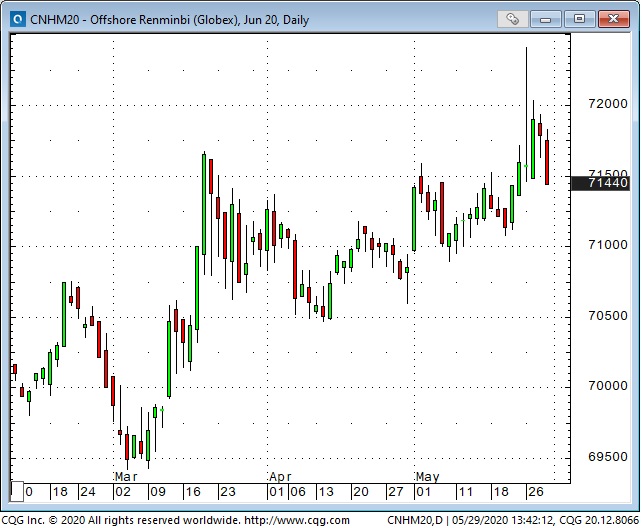
The Chinese RMB fell to a multi-year low this week...credit rising US/China tensions. (This chart shows an increasing amount of RMB are needed to buy USD.)
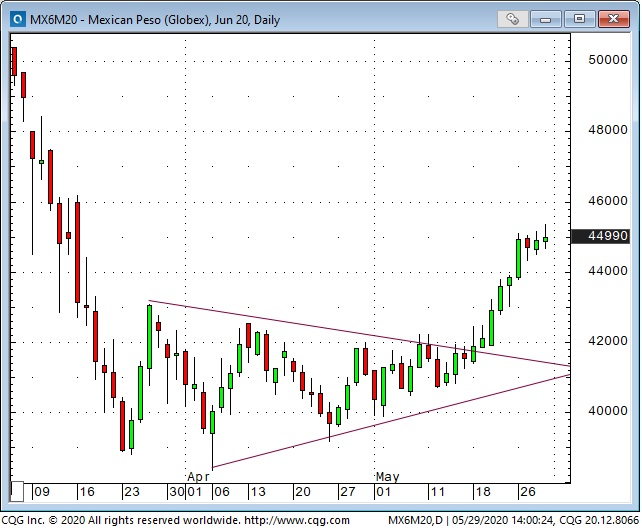
I’ve been both long and short MEX as a “derivative” of the stock market over the past few months. A couple of weeks ago I bought MEX on the idea that it had been clobbered during the Feb-March decline and looked like it might rally out of a wedge pattern. That worked very well but I exited the trade too early (trading is never a game of perfect!) and compounded my error by actually shorting MEX when the stock market looked like it was rolling over.
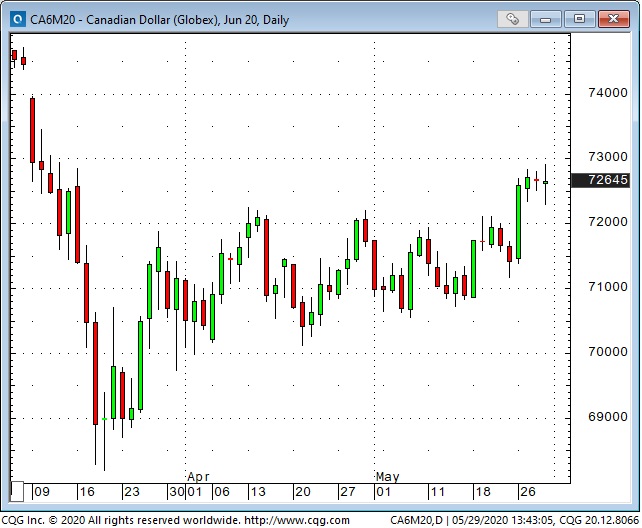
I’ve been both a buyer and a seller of CAD over the past couple of months. Lately, it seems to trade in sync with the stock market much more than with WTI so if the stock market looks soft I might get short CAD...if the chart looks right. I’m short CAD at the end of this week...although it also rallied a bit following Trump’s Friday afternoon China speech.
