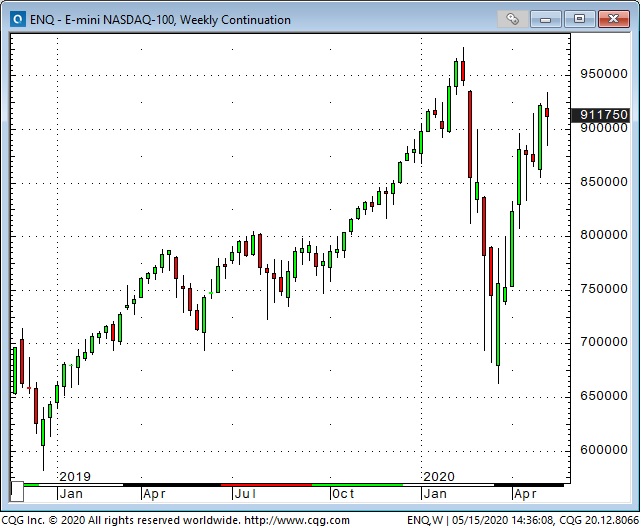
The Nasdaq 100 surged 9% into Monday’s highs on the back of 6 consecutive up days...but then it wobbled a bit...maybe due to rising US/China tensions...maybe due to fatigue after “too far / too fast”...maybe due to the wake-up calls from Druckenmiller and others...or maybe it was just the “pause that refreshes” and the BTD crowd will take this index to new All Time Highs any day now.
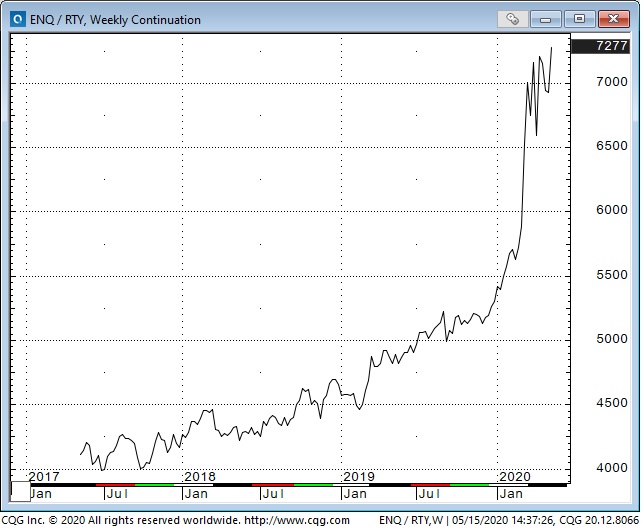
The surge higher in the Nasdaq 100 is on the back of a handful of big name “tech” stocks...but look at this Nasdaq 100 / Russell 2000 ratio chart to get some perspective on how incredibly high the Nasdaq 100 is flying relative to the leading small cap index.
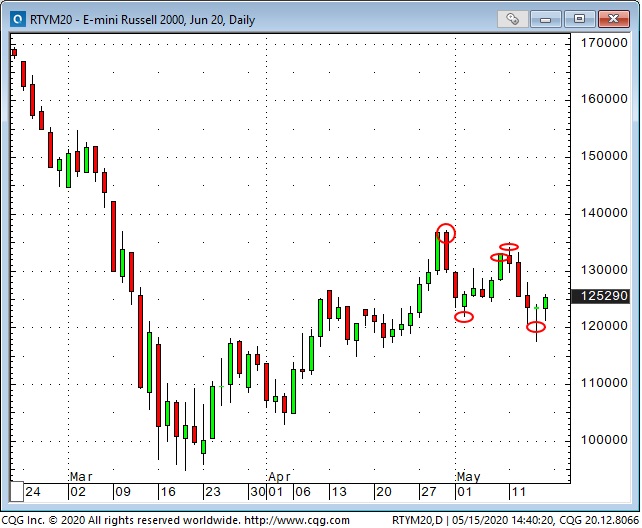
The Russell has been my “go to” index the past couple of weeks when I wanted to short “the stock market” (the old trading rule is that you short the weakest member in a group of markets...not the strongest member) but I’ve been nervous that it could rally on a “catch-up” play because it’s so “cheap” relative to the rest of the market. I sold the end of April highs and covered a few days later...got short again late last week but got stopped for a loss on the Friday rally...sold it again this Monday and covered early Thursday morning.
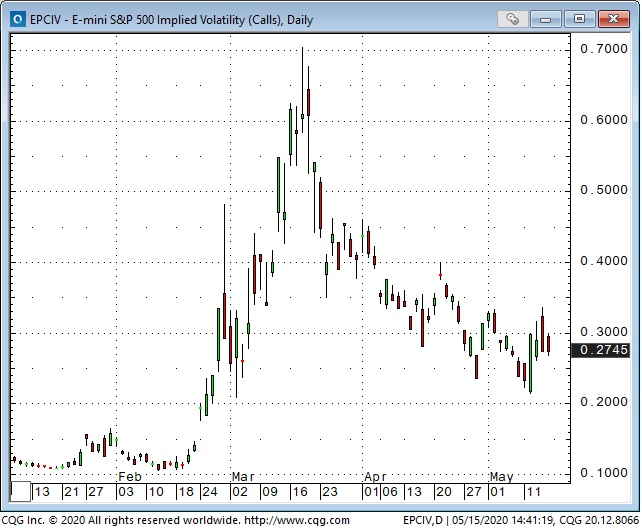
Volatility across markets continues to fall (especially in crude oil) but there was a bit of a pop in Vol this week when stocks went risk off for a couple of days.
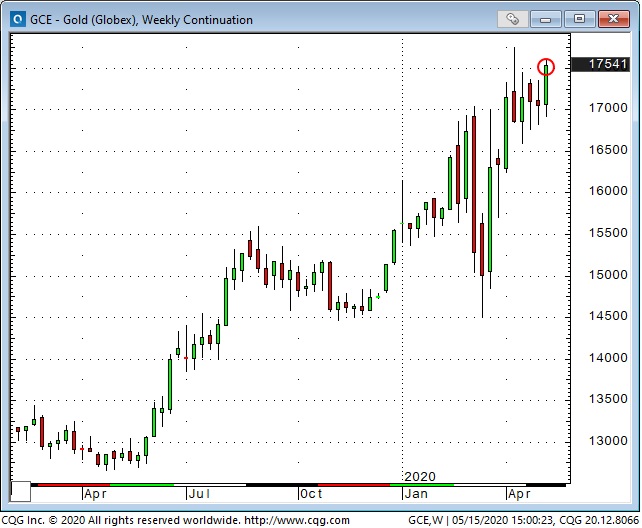
Gold had its best weekly close in 8 years this week...credit rising US/China tensions...and worries that those tensions will likely increase between now and the Presidential election that is less than 6 months away.
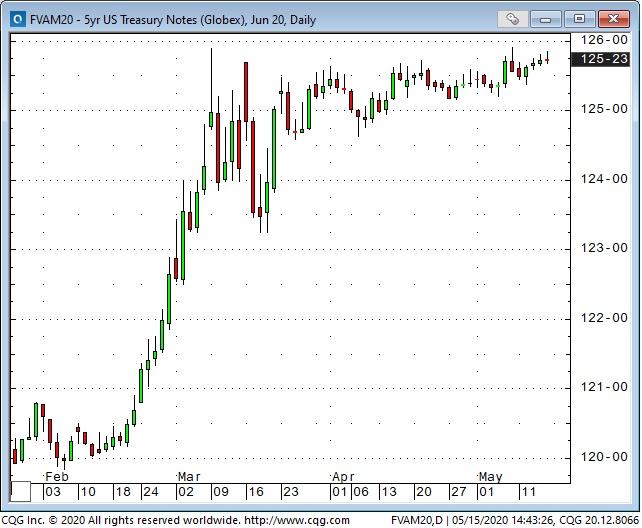
Interest rates staying ultra-low were also a positive for precious metals.
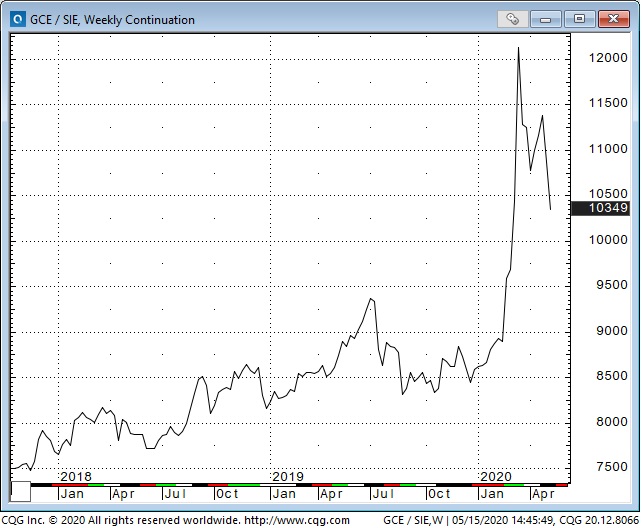
The gold/silver ratio hit 300+ year highs when the stock market hit panic lows March 23rd ( it took ~120 ounces of silver to buy one ounce of gold) but the spread has come in sharply as silver has rallied harder than gold the past 6 weeks.
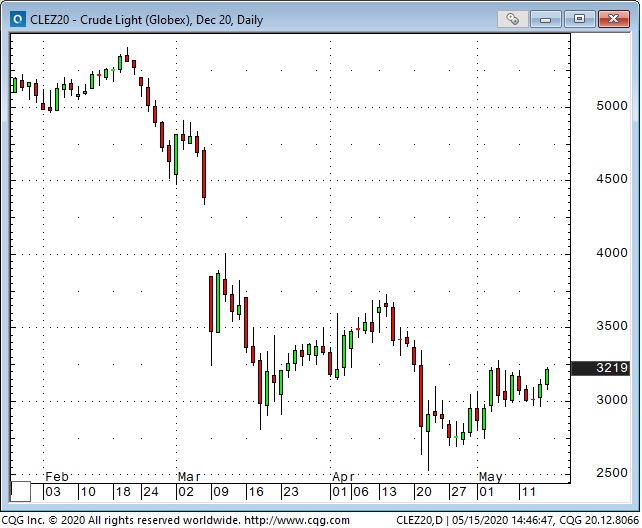
Crude oil has been “steady/better” since the April 20th plunge into negative prices...as global production apparently continues to decline...as demand seems to have increased...as concern about lack of storage has faded and as the contango has flattened. I’m looking at the December contract rather than the more nearby delivery dates because I think it represents more commercial/less speculative pricing.
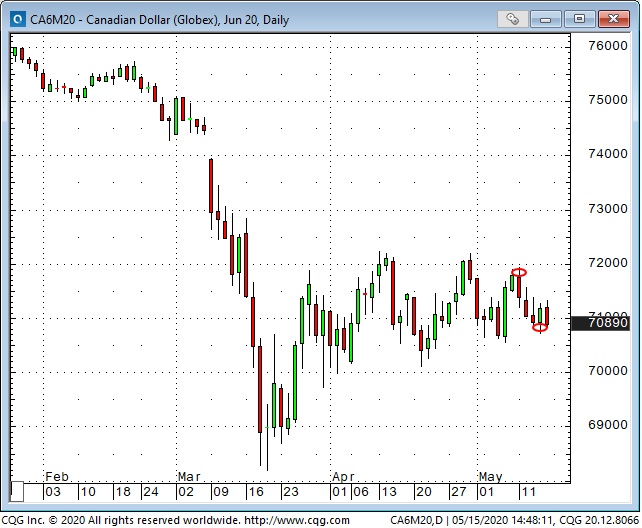
I sold CAD Monday when I saw it fall away from the 72 cent level that has been a top the past 6 weeks. I also saw CAD tracking the stock market (not crude oil) and I was bearish stocks. I covered the short position early Thursday morning when I covered my short Russell position.
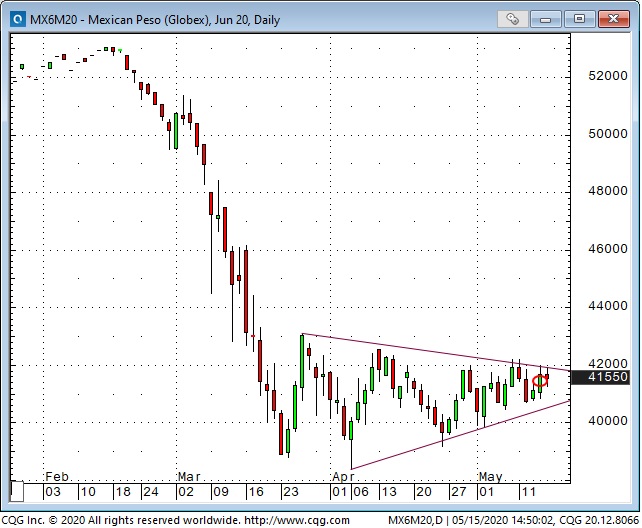
MEX fell hard (fell to record lows against USD) with the stock market into March and hasn’t had much of a bounce since. The wedge pattern the past 2 months looks interesting. I bought MEX Thursday (after I had covered my short Russell position) thinking that it could follow stocks higher and...IF...it takes out the highs of the past couple of weeks it could pop. My stop is just above this week’s lows.
