The news that “Buffet Buys Barrick Shares” spurred gold to rally more than $70 from last week’s close to Tuesday’s highs...the US Dollar Index falling to new 2 year lows also buoyed gold. We shorted gold on that rally and bought the US dollar against the euro currency.
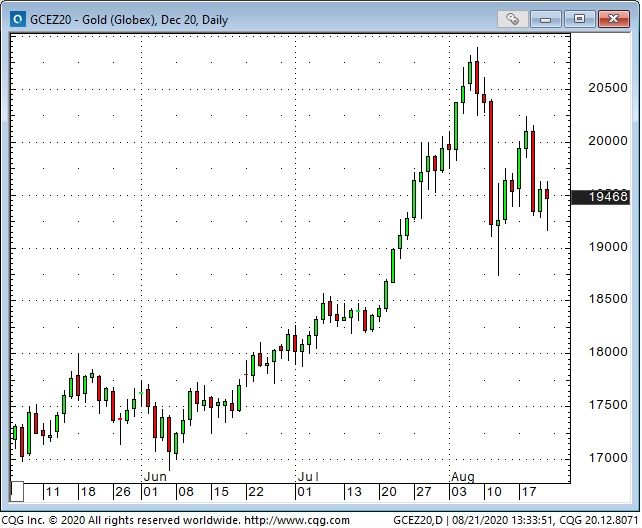
We covered a short gold position last week for a gain of ~$100 and were looking for a bounce this week to get short again. The Buffet/Barrick news and the weaker USD set up the opportunity. Our view has been that the $500+ rally in gold since March was WAY overdone and was driven by massive buying of American gold ETFs. Last week (ending Aug 14) saw the first net sales of American gold ETFs after 20 consecutive weeks of net buying.
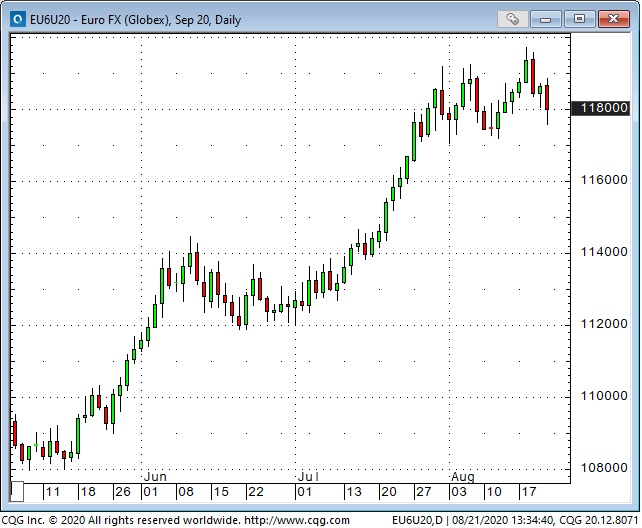
The US Dollar weakness story has been predominately a “euro strength” story with the EUR/USD up ~11% from the May lows to this week’s highs. Our view has been that the euro rally was WAY overdone with All-Time Record net speculative long positions in the futures market.
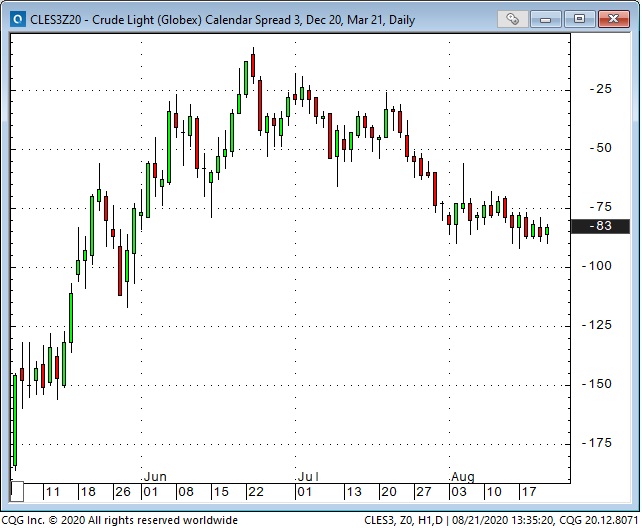
The crude oil market is a lack-of-demand story. We established bearish WTI contango spreads about 6 weeks ago (short Dec/Long Mar) and added to that trade 2 weeks ago. If front-month WTI drops below $40 those spreads will likely widen sharply. (This chart shows Dec trading at a discount of ~25 cents to Mar in early July. The spread is now ~83 cents. This change represents an unrealized gain of ~$580 per spread.)
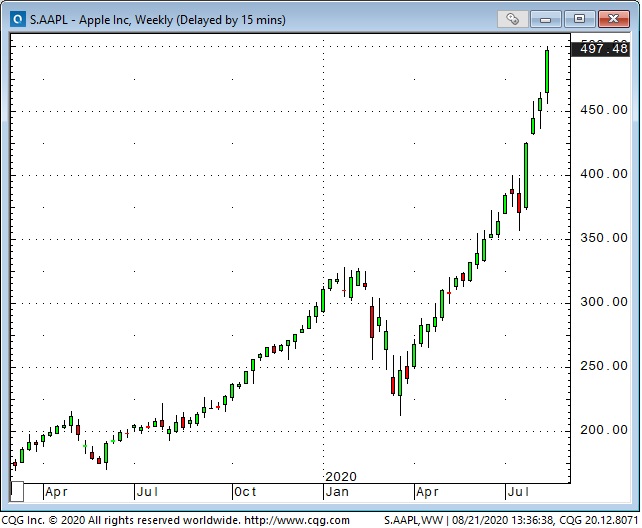
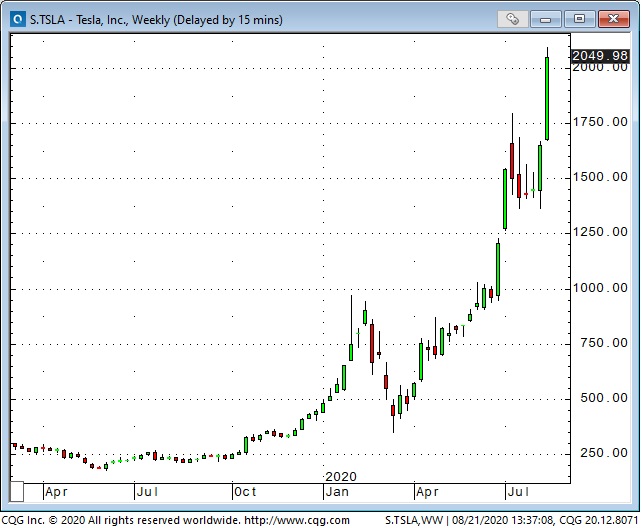
The S&P 500 index hit All-Time Highs this week...powered by mega-cap tech. (FB, AMZN, AAPL, MSFT and GOOG are up ~35% YTD while the other 495 stocks are down ~5% YTD.) A couple of months ago our view was that the bounce off the March lows was a bear market rally. We were wrong and thankfully we didn’t lose much money on that idea. We now think that the tech rally is WAY overdone...AAPL hit a $2 Trillion market cap this week...the share price and the P/E ratio have doubled since March. Tesla (NASDAQ:TSLA) shares have increased tenfold in the last 12 months. Both AAPL and TSLA are rallying ahead of share splits which commence trading Aug 31.
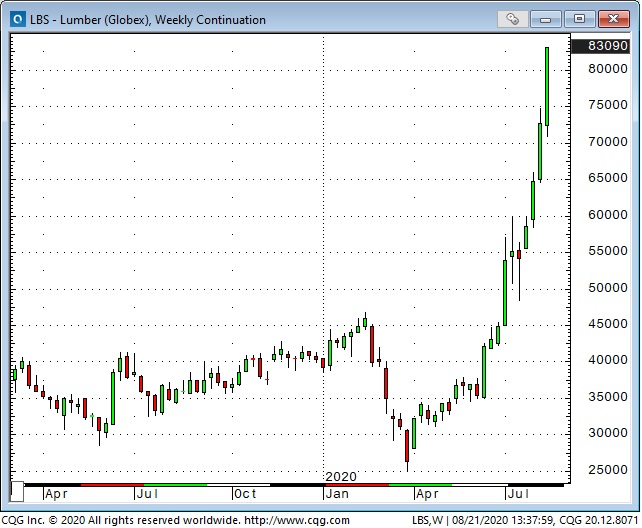
Lumber continues to soar as near term demand outstrips supply. American existing home sales continue to soar while the median countrywide selling price has surged above $300,000 (up ~8.5% YoY) for the first time ever.
Our short term trading: We take positions in the futures/options market looking for “prices” to move in our favor within the next few days/next few weeks. We form a “background” view on markets and then look for a catalyst or trigger to initiate a position. The catalyst could be the market’s reaction to some “news” (like the gold bounce on the Buffet story) while a trigger is more likely prices breaking/reaching a chart point.
We like to enter a trade where we think we have a chance of making at least 3 times as much as we are risking on the trade. We generally will not risk more than 1% of trading capital on a trade. If a market moves in our favor we like to move stops to breakeven as quickly as possible but will also look to add additional positions.
