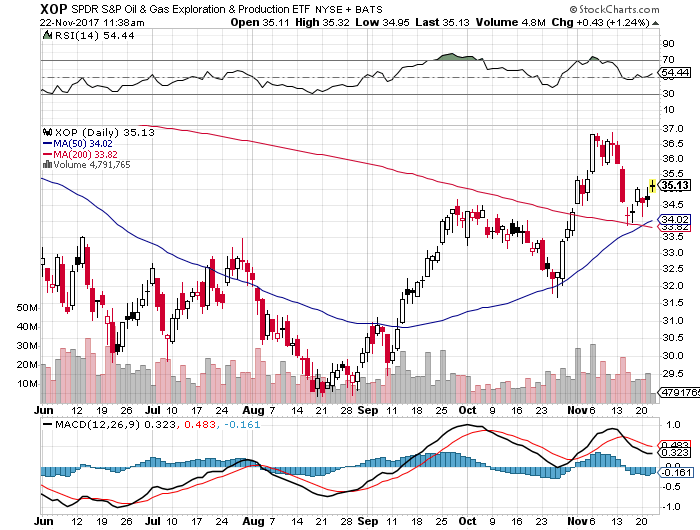
We speak about options activity in XOP (SPDR Oil & Gas Exploration & Production, Expense Ratio 0.35%, $2 billion in AUM) today in our ETF/Index Options recap, which consists of protective put buying in December.
We have seen some action in both the 34.50 and 33 strikes in XOP December puts, reflective of caution in the sector as this ETF has recently found support on its 200 day MA in the past couple sessions. XOP rallied nicely from the very end of October until mid-November where it staggered a bit, bringing it to present levels.
We note that the fund would still have to rally about 28% to get to its 52-week high of 44.97 even though most of November has provided a decent relief rally in the sector.
Year-to-date XOP has attracted very modest inflows to the tune of about $43 million in spite of seeing more than $125 million leave the doors via redemption pressure in the month of November alone. We have covered XOP frequently in this piece because when options players get involved in this sector, they generally choose XOP options to enact their hedges and/or directional plays, which likely has contributed to the fund’s asset base being far and above the next largest competitor in the sector, which is the $389 million IEO (iShares U.S. Oil & Gas Exploration & Production, Expense Ratio 0.44%).
The next biggest non-levered play in this space only has $50.7 million in assets under management and it is PXE (PowerShares Dynamic Energy Exploration & Production, Expense Ratio 0.80%). Given the recent downside put interest in XOP we are also closely watching the $41.5 million DRIP (Direxion Daily S&P Oil & Gas Exploration & Production Bear 3X, Expense Ratio 1.10%), which in spite of its moderate asset size, trades good daily volume thanks to the historical volatility and trading opportunities that seem to be present in the Oil & Gas Exploration space (1.1 million shares traded on a trailing one-month basis).
Its sister ETF, the bull levered GUSH (Direxion Daily S&P Oil & Gas Exploration & Production Bull 3X, Expense Ratio 1.07%) is substantially larger in size with $117 million in AUM, but it trades roughly the same number of shares on a trailing one-month basis (1.09 million shares daily).
XOP, as we have mentioned before employs a modified equal weighted methodology and GUSH and DRIP of course follow the same underlying index, only they employ daily long and short leverage respectively. Top holdings in XOP presently are: 1) CRZO (2.85%), 2) SM (2.54%), 3) HFC (2.36%), 4) WLL (2.35%) and 5) OAS (2.32%).

The SPDR S&P Oil & Gas Explore & Prod. ETF (XOP) was trading at $35.12 per share on Wednesday morning, up $0.42 (+1.21%). Year-to-date, XOP has declined -14.84%, versus a 17.29% rise in the benchmark S&P 500 index during the same period.
XOP currently has an ETF Daily News SMART Grade of C (Neutral), and is ranked #24 of 35 ETFs in the Energy Equities ETFs category.
