
The following is an excerpt from this week's Earnings Trends piece. To access the full article, please click here.
The Q1 earnings season is now effectively behind us, with results from 483 S&P 500 members already out. Total earnings for these index members are down -6.6% from the same period last year on -0.7% lower revenues, with 70.2% beating EPS estimates and 55.5% coming ahead of top-line expectations.
The side-by-side charts below put the Q1 results far from the 483 S&P 500 members in a historical context.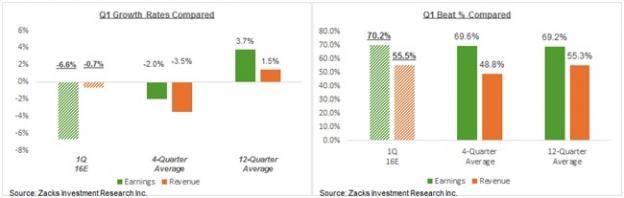
The left-hand side chart compares the Q1 earnings and revenue growth rates while the right side chart compares the percentage of companies coming out with positive earnings and revenue surprises. As you can see, the growth pace is notably weak relative to the 4-quarter and 12-quarter averages, but positive surprises are tracking above historical periods for the same group of companies. The recent decline in the exchange value of the U.S. dollar is helping S&P 500 members on the margin as well, but this preponderance of positive surprises is primarily a function of low expectations.
The chart below shows the proportion of the 483 index members that have beat both EPS and revenue estimates. Even on this metric, positive surprises are more numerous relative to historical periods.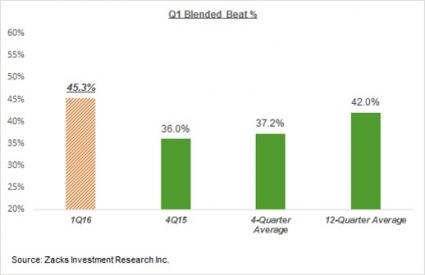
The Retail Disappointment
The focus lately has been on the disappointing Retail sector results, with a variety of traditional brick-and-mortar operators coming short of already-low estimates. We saw this with Macy’s (M) and the other department stores earlier, with even Target (TGT) and Best Buy (BBY) seemingly not immune to the trend.
There is a lot of talk about weak consumer demand in the apparel category, but management teams have failed to come up with any plausible explanation for why that is the case when aggregate consumer spending trends appear to be just fine. The most logical explanation for retailers’ woes seems to be their inability to come out with a compelling response to the Amazon (NASDAQ:AMZN) (AMZN) challenge. While a number of these retailers have come out with so-called Omni- and multi-channel strategies to address this issue, the ground reality is that they have failed to come out with a compelling alternative to the Amazon offering.
Let’s keep in mind that not all traditional retailers are doing bad – the discounters like Kohl’s (KSS) and Wal-Mart (NYSE:WMT) (WMT) seem to be holding up just fine and Home Depot (NYSE:HD) (HD) and the other home-improvement players are doing great. That said, there is no doubt that most of the traditional retailers are losing out to Amazon.
With respect to the sector’s Q1 scorecard, we now have results from 94.6% of the sector’s total market capitalization in the S&P 500. Total earnings for these retailers are up +2.4% from the same period last year on +5.4% higher revenues, with 68.4% beating EPS estimates and 50% coming ahead of top-line expectations.
This performance actually compares favorably to what we have seen from the same group of retailers in other recent periods, as the side-by-side comparison charts blow show.
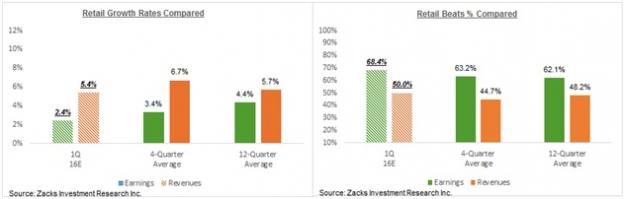
As you can see, the Q1 earnings and revenue growth pace is only modestly below the 4- and 12-quarter averages, while the proportion of retailers coming out with positive EPS and revenue surprises is actually materially better relative to those historical periods. The more numerous positive surprises from the Retail sector appear to be a continuation of what we have been seeing from other sectors this earnings season, a reflection of low estimates.
The decent-looking growth pace in Q1, however, is a reflection of strong results at Amazon. Once we exclude Amazon from the Retail sector results, the comparisons start looking decidedly unfavorable. The side-by-side charts below compare the Retail sector’s earnings and revenue growth rates, with and without Amazon.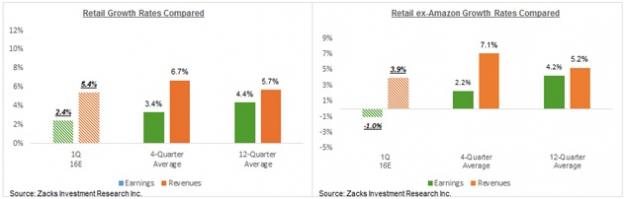
The recent underperformance of retail stocks is mostly because of tepid guidance for the current period instead of soft Q1 results. You can see the impact of guidance on how Q2 earnings growth expectations for the sector have evolved over the last few weeks, as the chart below shows.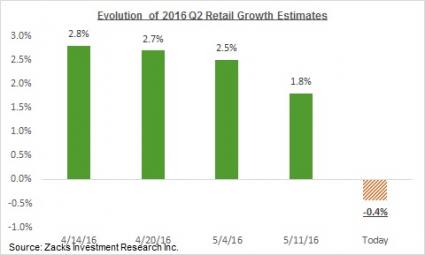
Earnings Picture Beyond 2016 Q1
Our summary take on the Q1 earnings season is that while growth remained nonexistent, actual results turned out to be less bad relative to the low levels to which estimates had fallen ahead of this reporting cycle. More companies came out with positive surprises for both earnings as well as revenues.
Importantly, while estimates for the current period (2016 Q2) have come down, they haven’t fallen as much as was the case at the comparable stage in the prior earnings season. Low expectations likely explain part of the deceleration in the negative revisions pace for Q2 as estimates for this period had already come down over the last four months. The recent favorable movement in the U.S. dollar’s exchange value is likely helping matters on the margin as well.
Total earnings for the S&P 500 index are currently expected to be down -6.1% from the same period last year. The chart below shows Q2 earnings growth expectations have evolved over the last few weeks.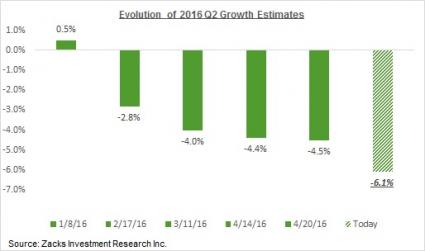
The chart below shows Q1 growth expectations contrasted with what was actually achieved in the preceding three quarters and estimates for the following four periods. Full-year 2016 earnings growth expectations have now turned negative, similar to what we saw last year.

Many see the Q1 earnings season as the inflection point for corporate earnings, with the growth picture starting improve from Q2 onwards and turning positive in the back half of the year. The relative more numerous positive surprises and the fewer negative revisions to current-period estimates would support that view. But the proof of this narrative will become clear in the coming days as more companies report Q1 results and provide color on the evolving business picture.
To access the full Earnings Trends article, please click here.
Note: Want more articles from this author? Scroll up to the top of this article and click the FOLLOW AUTHOR button to get an email each time a new article is published.
WAL-MART STORES (WMT): Free Stock Analysis Report
TARGET CORP (TGT): Free Stock Analysis Report
MACYS INC (M): Free Stock Analysis Report
KOHLS CORP (KSS): Free Stock Analysis Report
HOME DEPOT (HD): Free Stock Analysis Report
BEST BUY (BBY): Free Stock Analysis Report
AMAZON.COM INC (AMZN): Free Stock Analysis Report
Original post
Zacks Investment Research