US curves steepens amid a better labor market and improving risk sentiment, long USD/JPY?
US initial jobless claims hit the lowest level since 1973, risking upcoming jobs report to the upside.
Judging from the Volatility Index, talk of a trade war is no longer the dominating driver at this moment. However, it's unlikely the end of the story. China urged trade talks with US to prevent greater damage to relations while saying that previously announced retaliatory measures on American imports took effect on Monday. For now, US jobs data could be the key driver for cross-assets.
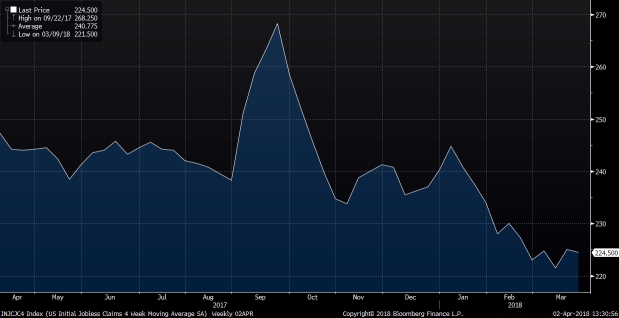
The number of Americans claiming new unemployment benefits fell last week to the lowest level since 1973, signalling continued health in the labor market. Initial jobless claims, a proxy for layoffs across US, fell by 12,000 to a seasonally-adjusted 215,000 on March 24 as the Labor Department issued the data a few days ago. This marked the lowest level for claims since they hit 214,000 in January 1973. The four-week moving average of claims, considered a more stable measure because it smooths out weekly volatility in the data which fell by 500 to 224,500 last week. This put some hopes that the upcoming US jobs report released this Friday could reach 4.0%.
Source: Bloomberg
Weekly jobless claims have held below 300,000 for about three years, the longest streak since 1970, when US population was far smaller than it is today. The low level of claims is among multiple signs of health in the US labor market. The unemployment rate has held at 4.1% since October, its lowest level since December 2000. Nonfarm employers added a robust 313,000 jobs in February as well. Wages are rising modestly, which is one of the key data for market to gauge the inflation outlook.
The evidence of sustained stronger price gains could prompt the Fed to be somewhat more aggressive in lifting its benchmark interest rate in an effort to keep the economy from overheating. On the other hand, signs of continued soft price increases could encourage some Fed officials to seek a slower pace of rate increases.
US Treasuries steepened across the curve in Asia’s trading session today as stocks advanced slightly, with the benchmark 10-Year up 2bps to 2.76% following Friday’s holiday in the US. This could support the dollar before the payrolls data.
Our Picks
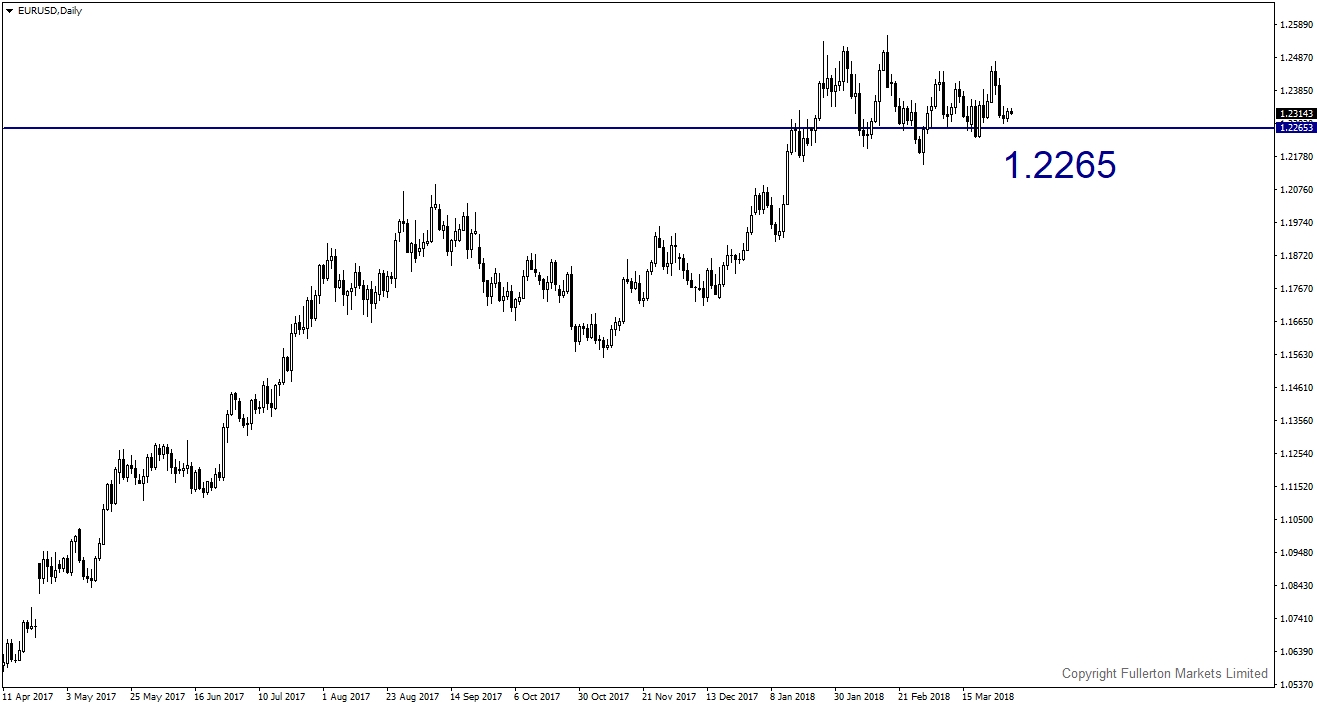
EUR/USD – Slightly bearish.
Price may continue to consolidate and test the lower bound of the range, which stands around 1.2265
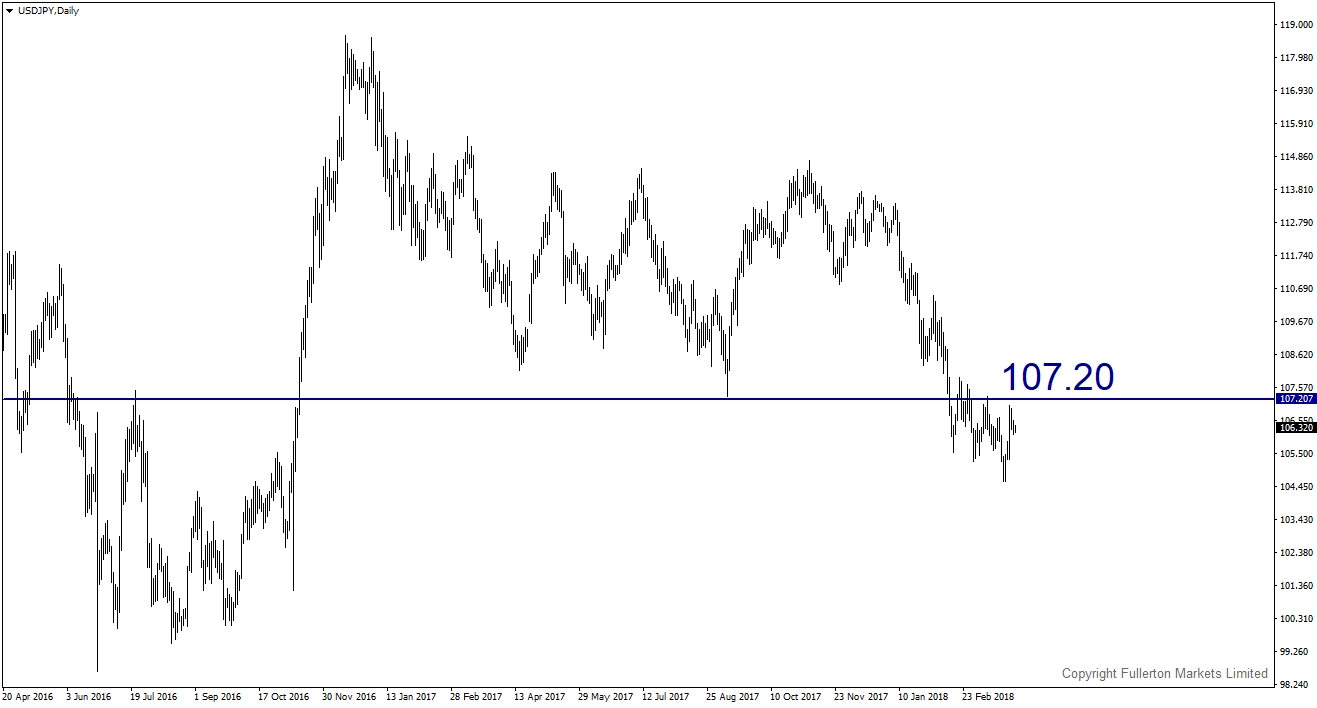
USD/JPY – Slightly bullish.
Recover in global equities sentiment could bring this pair towards 107.20
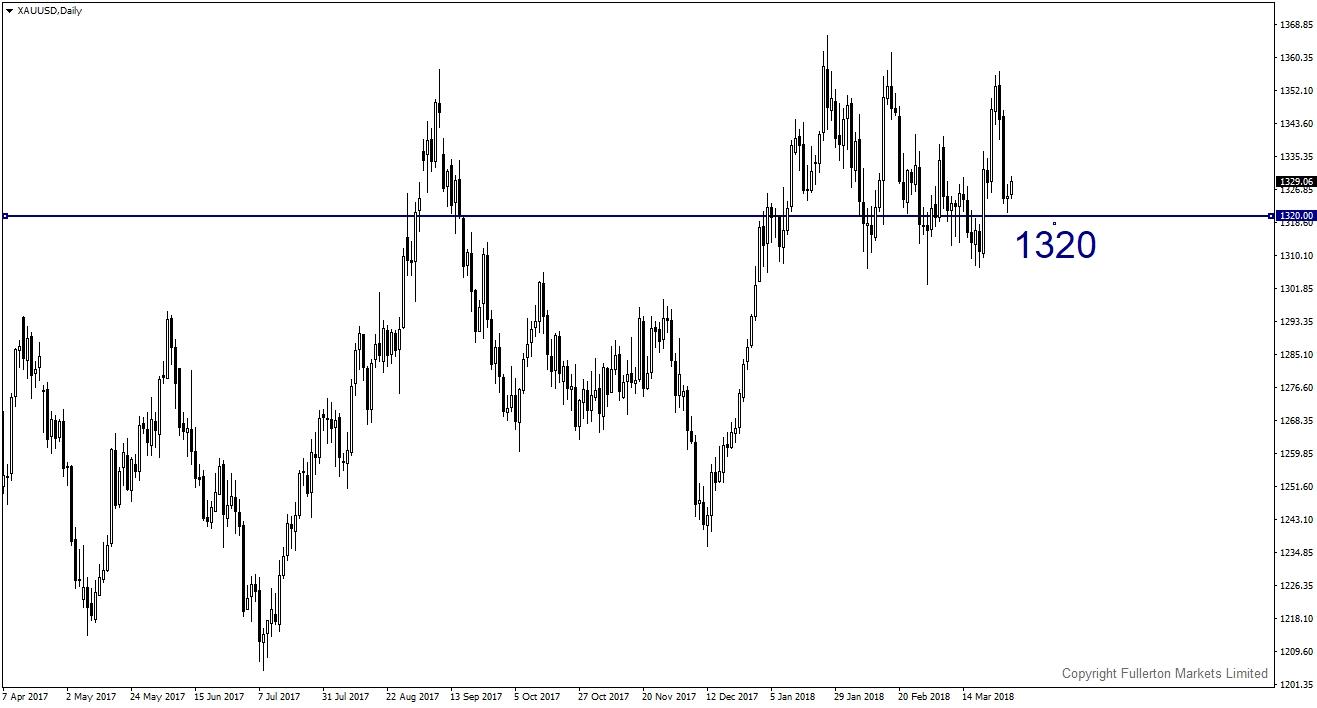
XAU/USD (Gold) – Slightly bearish.
We expect price to fall towards 1320 this week.
Fullerton Markets Research Team
Your Committed Trading Partner


