Here are the Rest of the Top 10 with Premium Content in Bold:
AstraZeneca PLC (NYSE:AZN)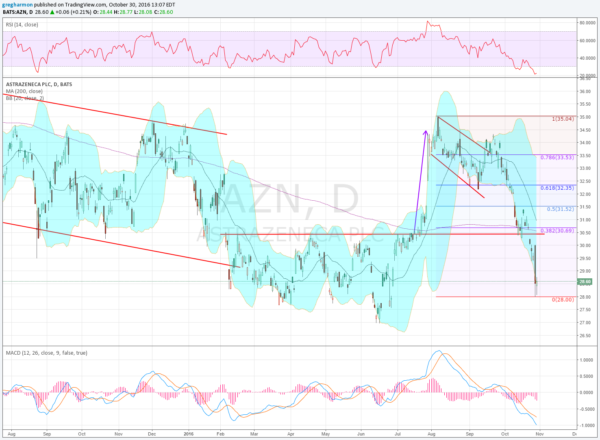
AstraZeneca, AZN, went through a bottoming consolidation from February until it broke to the upside in July. The quick move higher met resistance at the December highs and then price started lower. The slow drop accelerated in October and it had a massive drop on Thursday. It ended Thursday with a bottoming lower shadow and printed a second one on Friday, both on large volume. The RSI is oversold and the MACD is at an extreme low. There is potential for a bounce. Look for a move over Friday’s high to participate to the upside.
Broadly the stock has seen the 30.50 level show significant importance and a 38.2% retracement of the down leg would touch 30.69. There is resistance at 29.50 and 30.50 followed by 31.50 and 32.50. Support lower comes at 28.40 and 28. Short interest is low at 1.2%. Enter long on a move over 28.75 with a stop at 28. As it moves over 29.20 move the stop to a 45 cent trailing stop and let the stop take you out unless it moves fast to 32.35 and stalls, then sell there. As an options trade consider the November 4 Expiry 28.5 Calls (offered at 70 cents late Friday) and trade them like the stock trade (using the stock price as a trigger, stop and target). There is not a lot of open interest but max pain this week looks like it would be at 31.5 or a bit higher. The company reports earnings next week and has big open interest at 32.50.
Fortinet Inc (NASDAQ:FTNT)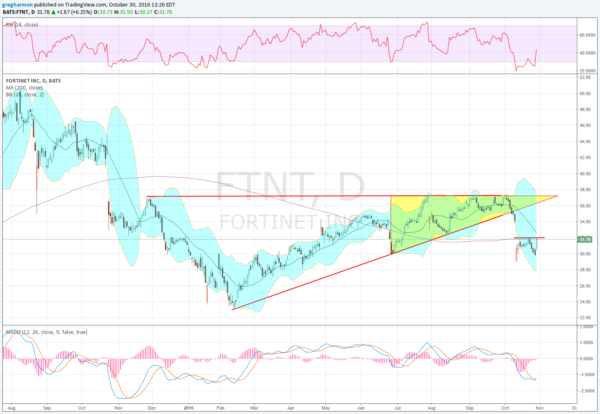
Fortinet, FTNT, had been trending higher until it met resistance in late July. It bounced lower from that resistance 3 times with the last one leading to gap lower on strong volume. Since that gap down the stock has consolidated and Friday saw a push to the top of the range. The RSI is rising and the MACD is about to cross up. Look for a break higher to participate to the upside.
The broader picture shows the breakdown out of an ascending triangle stopping just short of the target move lower. The 200 day SMA has now become resistance and a move over it is a buy signal. There is resistance at 31.95 and 32.50 with a gap to fill to 34 then 37.25. Support lower comes at 29.80 and 29. Short interest is low at 2.9%. Enter long on a move over 31.95 with a stop at 29.80. As it moves over 32.50 move the stop to break even and then to a 75 cent trailing stop over 32.70. Take off 1/3 on a stall at 37.25 or higher. As an options trade consider the November 32 Calls (95 cents) and trade them like the stock trade.
Home BancShares Inc (NASDAQ:HOMB)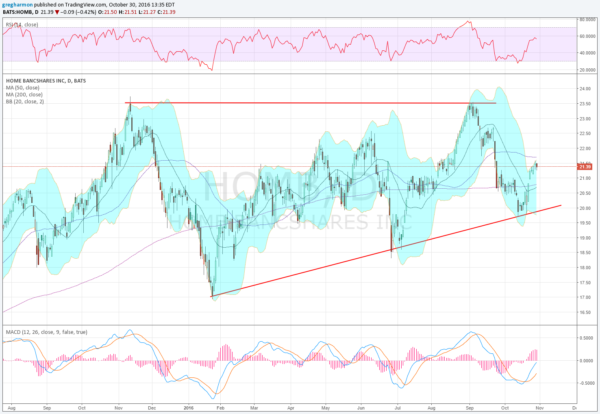
Home Bancshares, HOMB, ran higher from the Brexit sell off at the end of June. It stalled at the SMA’s and then continued to the November 2016 high. That was it though. A pullback started from there that found support in October. It started back higher 2 weeks ago, hitting the upper Bollinger Band® Thursday and pulling in. The RSI is on the edge of a move into the bullish zone while the MACD is rising. Look for continuation to participate to the upside.
The stock has made a series of higher lows along the way. There is resistance at 21.60 and 22.30 followed by 22.55 and 23.10 then 23.50. Support lower comes at 21 and 20.50. Short interest is moderate at 6.1%. Enter long on a move over 21.50 with a stop at 21. As it moves over 21.70 move the stop to break even and then to a 35 cent trailing stop over 21.85. Take off 1/3 on a stall at 23.50 or higher. Stay away from options in this name.
Honeywell International (NYSE:HON)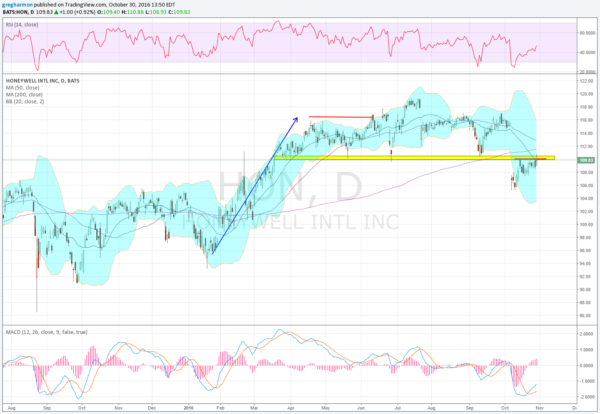
Honeywell International, HON, started moving higher in January. It met resistance in July but held over 111 for 7 months, before losing it and dropping lower. The price action since the gap down has been consolidating against resistance and has support of a rising RSI and MACD to push through to the upside. Look for that to happen to participate higher.
The 109.80 to 110.50 area has been significant at both support and resistance since March. A push through that would look for a gap fill to 115.25. There is resistance along the way at 110.50 and 112 followed by 114.60. Support lower comes at 108.60 and 107.50. Short interest is low under 1%. Enter long on a move over 110.50 with a stop at 108.60. As it moves over 111.50 move the stop to break even and then to a $1.50 trailing stop over 112. Take off 1/3 on a stall at 116 or higher. As an options trade consider the November 110 Calls ($1.74) and trade them like the stock trade.
Northern Trust (NASDAQ:NTRS)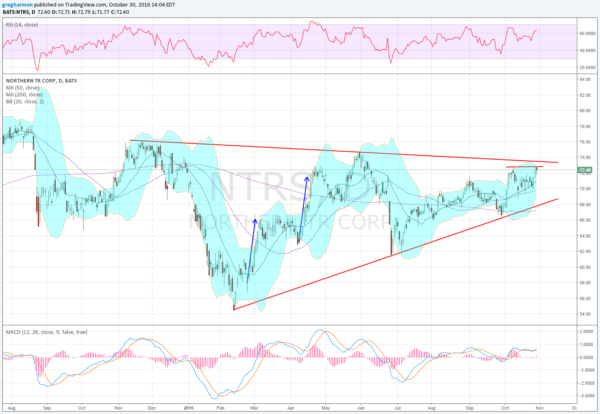
Northern Trust, NTRS, fell hard at the start of the year, to a low in February. It rose from there to a lower high in May before pulling back. That move found support in June and reversed higher. It ended last week at resistance and pressing higher. The RSI is rising and in the bullish zone while the MACD is rising. Look for a push over resistance to participate to the upside.
The price action has created a symmetrical triangle and the price is now near a breakout that would target a move to 95. There is resistance at 72.80 and 74.75 followed by 76.10 and 78. Support lower comes at 71.60 and 70. Short interest is low under 1%. Enter long on a move over 72.80 with a stop at 71.60. As it moves over 73.60 move the stop to break even and then to a $1.40 trailing stop over 74.20. Take off 1/3 on a stall at 95 or higher. As an options trade consider the November 72.5 Calls ($1.55) and trade them like the stock trade.
After reviewing over 1,000 charts, I have found some good setups for the week. These were selected and should be viewed in the context of the broad Market Macro picture reviewed Friday which heading into the last week full week before the election the equity markets continue to look troubled on the short timeframe, with the weakness starting to leak into the longer timeframe for the small caps.
Elsewhere look for Gold to drift higher while Crude Oil continues the short term move lower. The US Dollar Index looks ready for consolidation or a pullback short term while US Treasuries are biased lower. The Shanghai Composite looks to continue to drift higher as Emerging Markets are biased to the downside in consolidation.
Volatility looks to remain in the normal range but creeping up so adding a headwind for the equity index ETF’s SPDR S&P 500 (NYSE:SPY), iShares Russell 2000 (NYSE:IWM) and PowerShares QQQ Trust Series 1 (NASDAQ:QQQ). Their charts also show short term weakness with the IWM the weakest as it falls and the SPY next but the QQQ still holding near all-time highs. Use this information as you prepare for the coming week and trad’em well.
DISCLAIMER: The information in this blog post represents my own opinions and does not contain a recommendation for any particular security or investment. I or my affiliates may hold positions or other interests in securities mentioned in the Blog, please see my Disclaimer page for my full disclaimer.
