After reviewing over 1,000 charts, I have found some good setups for the week. This week’s list contains the first five below to get you started early. These were selected and should be viewed in the context of the broad Market Macro picture reviewed Friday which with Thanksgiving behind and the holiday shopping season in full swing saw the price action in the equity markets casting a dark shadow over the festivities.
Elsewhere look for Gold to continue in its uptrend while Crude Oil continues to move lower. The US Dollar Index is resuming its move higher while US Treasuries are reversing to the upside. The Shanghai Composite may also be reversing higher while Emerging Markets continue to pause in their downtrend.
Volatility remains elevated and has an upward bias which is keeping the bias lower for the equity index ETF’s SPY (NYSE:SPY), IWM and QQQ. Their charts all look weak on the shorter timeframe, with the QQQ the worst under the October lows and nearing the February lows. The IWM is nearing 12 month support while the SPY sits at the October low. Use this information as you prepare for the coming week and trad’em well.
Assembly Biosciences Inc (NASDAQ:ASMB)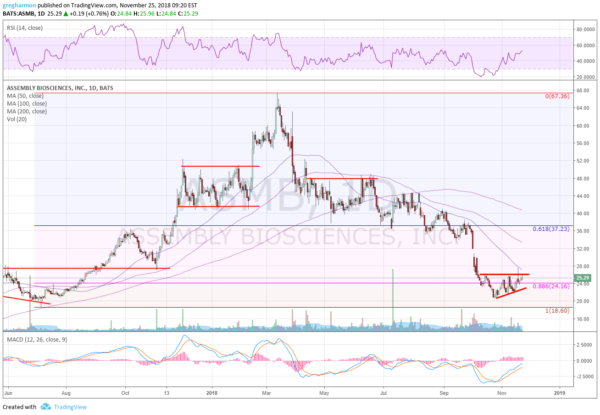
Assembly Biosciences, $ASMB, made a bottom at the end of October after retracing over 88.6% of the move higher from June 2017 to March. It has been consolidating since then with a positive momentum divergence, and making higher lows. The RSI is rising towards the bullish zone with the MACD about to turn positive. There is resistance at 26.15 and 27.50 then 30 and a gap to fill to 32. Support lower comes at 23.70 and 22.20. Short interest is moderate at 3.7%. Enter long on a move over 26.15 with a stop at 25. As it moves over 27 move the stop to break even and then to a $1.25 trailing stop over 27.40. Let the stop take you out of the trade. Options are thinly traded with wide strikes, stick with the stock.
Cadence Design Systems Inc (NASDAQ:CDNS)
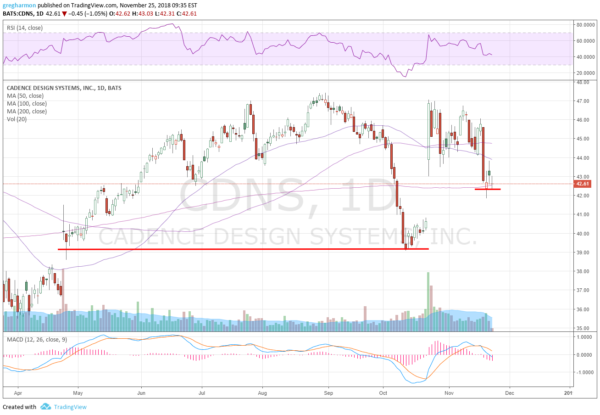
Cadence Design, $CDNS, pulled back from a top at the end of August and accelerated lower. It found support at the gap area from April and started higher into October. A gap up retested the high before it started to drift back lower. Now it is consolidating at the 200 day SMA. A drop lower sees two gaps to fill. The RSI is on the edge of a move into bearish territory with the MACD turning negative as it falls. There is support lower at 42.25 and 41 then 39.65 and 39.15 before a gap to fill to 37. Resistance higher comes at 43.35 and 44.20. Short interest is low at 2.1%. Enter short on a move under 42.20 with a stop at 43. As it moves under 41.50 move the stop to break even and then to a $1 trailing stop under 41.20. Let the stop take you out of the trade. Options are thinly traded but there is big open interest at the December 42 Put (offered at $1.25 late Friday) at a price equal to the stop size. Consider using them for a defined risk trade.
CF Industries Holdings Inc (NYSE:CF)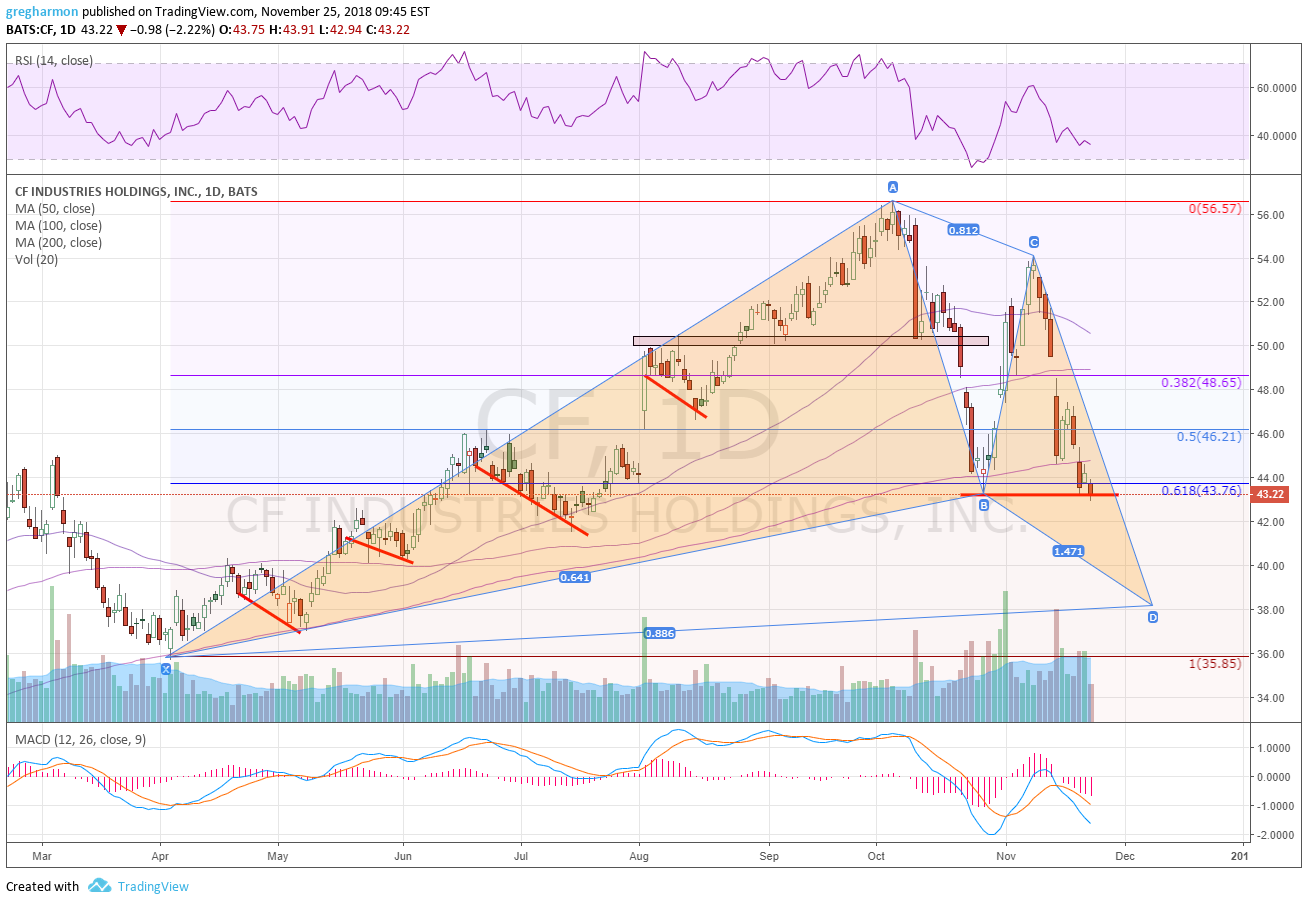
CF Industries, $CF, rose from a bottom in April to a top in October. It pulled back from there, retracing 61.8% of the move before bouncing and rising to a lower higher. The pull back from there has reached that prior bottom and looks headed to complete a bullish Bat harmonic with a Potential Reversal Zone (PRZ) at 38.20. The RSI is falling and bearish with the MACD falling. There is support at 43.20 and 42.30 then 40.40 and 38.50 before 37.15. Resistance sits at 44 and 44.85. Short interest is moderate at 3.1%. Enter short on a move under 43 with a stop at 44. As it moves under 42 move the stop to a $1.25 trailing stop and let the stop take you out of the trade. As an options trade consider the December 43 Puts ($2.14) and trade them like the stock trade (using the stock price as a trigger, stop and target). Sell the December 38 Puts (47 cents) to lower the cost.
Collegium Pharmaceutical Inc (NASDAQ:COLL)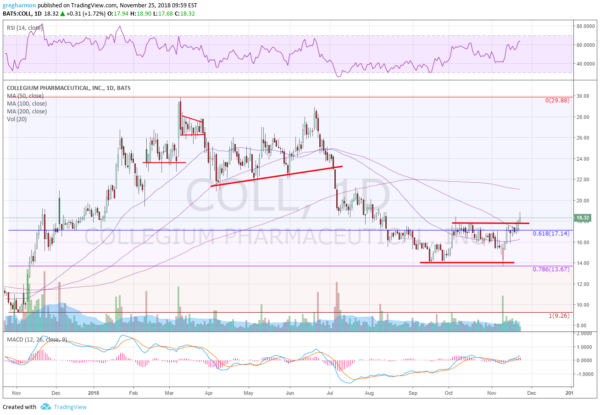
Collegium Pharmaceutical, $COLL, started lower in June and confirmed double top in July as it made its way lower. It eventually retraced 78.6% of the move up from the November 2017 low to the March high. Last week ended with it pushing to a higher high and over the 100 day SMA. It has a RSI rising in the bullish zone with the MACD rising and positive. There is resistance at 19 and 20.60 then 21.90 and 23.60. Support lower comes in at 17.75 and 16.75. Short interest is high at 11.4%. Enter long now (over 17.75) with a stop at 17.15. As it moves over 19 move the stop to break even and then to a $1.10 trailing top over 19.40. Let the stop take you out of the trade. Options spreads are too wide to use for this trade.
Fortinet Inc (NASDAQ:FTNT)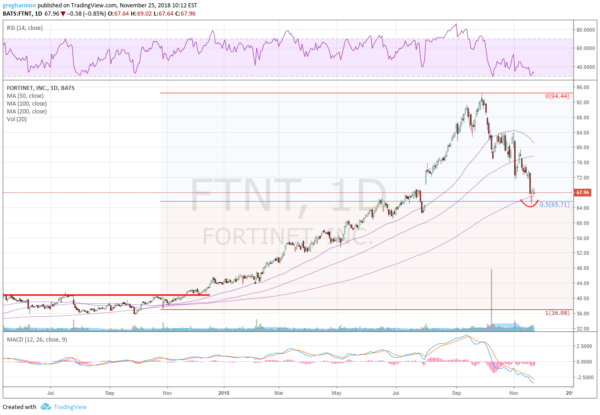
Fortinet, FTNT, had a year long run higher to a top in October. It has pulled back from there, filling the gap from August and retesting the 200 day SMA at a 50% retracement of that move. The RSI is bouncing along the oversold line in bearish territory with the MACD falling. There is support at 65.50 and 62.60 then 61.45 and 52.30 before 54.75. Resistance above sits at 70 and 72 then 77.15 and 81.25. Short interest is moderate at 4.3%. Enter short on a move under 65.50 with a stop at 67. As it moves under 64 move the stop to a $1.25 trailing stop and let the stop take you out of the trade. As an options trade consider the December 65 Puts ($2.15) and trade them like the stock trade. Sell the December 55 Puts (30 cents) to lower the cost. Enter long on a move over 70 with a stop at 67. As it moves over 71.50 move the stop to a $1.25 trailing stop and let the stop take you out of the trade. As an options trade consider the December 70 Calls ($2.60).
The information in this blog post represents my own opinions and does not contain a recommendation for any particular security or investment. I or my affiliates may hold positions or other interests in securities mentioned in the Blog, please see my Disclaimer page for my full disclaimer.
Which stock should you buy in your very next trade?
With valuations skyrocketing in 2024, many investors are uneasy putting more money into stocks. Unsure where to invest next? Get access to our proven portfolios and discover high-potential opportunities.
In 2024 alone, ProPicks AI identified 2 stocks that surged over 150%, 4 additional stocks that leaped over 30%, and 3 more that climbed over 25%. That's an impressive track record.
With portfolios tailored for Dow stocks, S&P stocks, Tech stocks, and Mid Cap stocks, you can explore various wealth-building strategies.

