Here are the Rest of the Top 10:
Atmel, Ticker: NASDAQ:ATML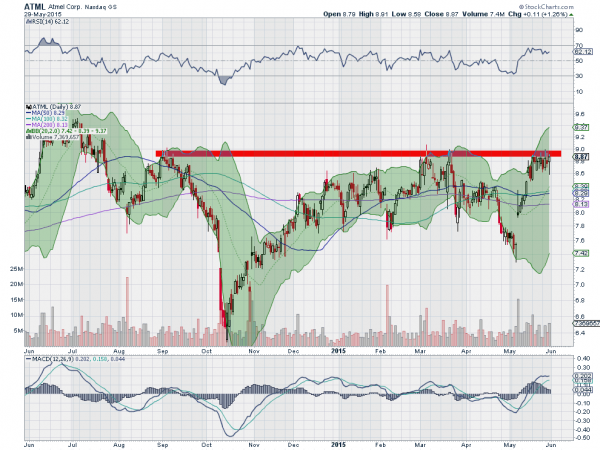
Atmel, ATML, is back at resistance that has held it since September. This time it comes from a higher low. As it consolidates under resistance the RSI is bullish and strong while the MACD is just leveling, not pulling back. A break above 9 would trigger a Measured Move to 10.20.
Chicago Bridge & Iron, Ticker: NYSE:CBI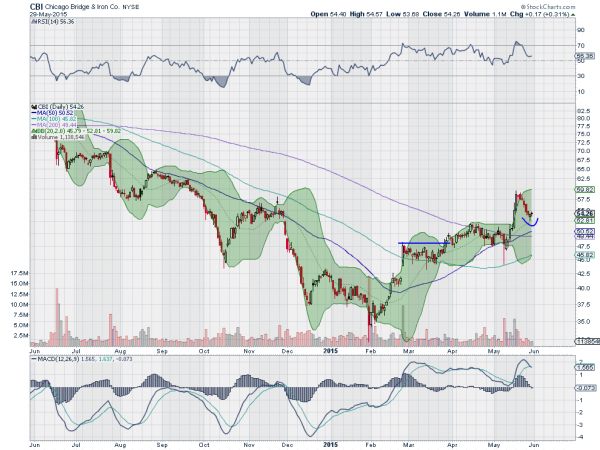
Chicago Bridge & Iron, CBI, had a long move lower that found a bottom in February. Since then it has stair stepped higher. Two weeks ago it made a high, outside of the Bollinger Bands® and has been pulling back ever since. But the Hammer reversal candle Thursday was confirmed higher Friday. The RSI has already turned up but with the MACD still falling.
ImmunoGen, Ticker: NASDAQ:IMGN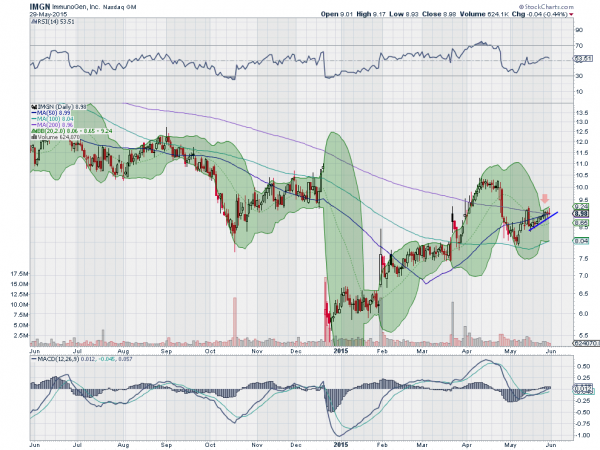
ImmunoGen, IMGN, started higher in December reaching a top in April near 10.50. After a pullback that found support in May it started back higher and is rising along trend support. What makes this interesting now is that the Bollinger Bands are opening higher. The RSI is over the mid line and the MACD is rising, both supporting further upside price action.
MasterCard, Ticker: NYSE:MA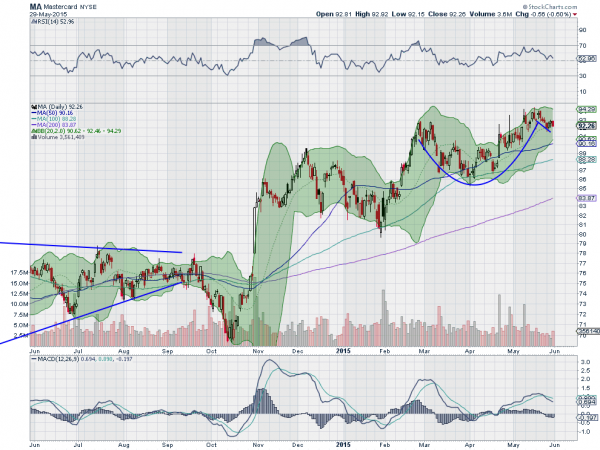
MasterCard, MA, fell out of a symmetrical triangle in September but it turned out to be a false breakdown as the price quickly found support and rose. It has made two steps higher, with the current one looking like a Cup and Handle pattern. As it pulls back in the Handle the RSI is falling but remains positive, while the MACD is falling.
Pandora Media, Ticker: NYSE:P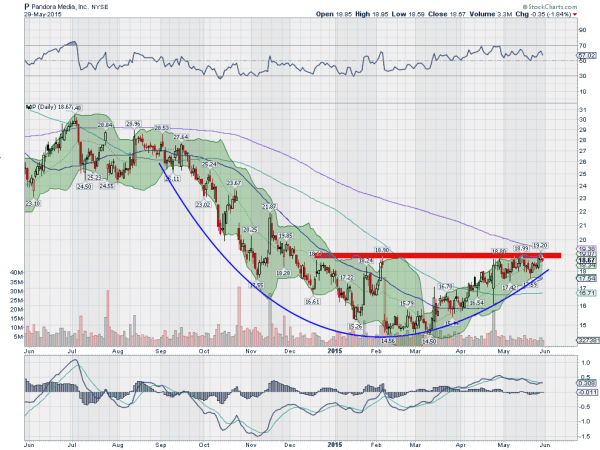
Pandora Media, P, had been pulling back since making a top in March 2014. the first leg brought it to 22 and then it bounced before starting the second leg lower in June 2014. That leg achieved the Measured Move lower in February. Since then notice the rounding bottom that has been building. Now it is at resistance with the RSI in the bullish zone while the MACD is trying to cross up.
After reviewing over 1,000 charts, I have found some good setups for the week. These were selected and should be viewed in the context of the broad Market Macro picture reviewed Friday which, heading into June sees the equity markets as mixed, with the NASDAQ:QQQ strong but the ARCA:SPY and ARCA:IWM showing some short term weakness.
Elsewhere look for gold to continue to hold between 1180 and 1200 while crude oil consolidates with an upward bias. The US Dollar Index looks to continue higher while US Treasuries also are looking stronger, possibly breaking their downtrend. The Shanghai Composite is in pullback mode in the uptrend but at a good support level, while Emerging Markets are falling and look weak.
Volatility looks to remain subdued keeping the bias higher for the equity index ETF’s SPY, IWM and QQQ. Their charts are a bit mixed, with all better on the weekly timeframe than the daily, and the QQQ’s the strongest short term while the SPY and IWM may pullback. Use this information as you prepare for the coming week and trad’em well.
DISCLAIMER: The information in this blog post represents my own opinions and does not contain a recommendation for any particular security or investment. I or my affiliates may hold positions or other interests in securities mentioned in the Blog, please see my Disclaimer page for my full disclaimer.
