Here are the Rest of the Top 10:
Agrium Inc (NYSE:AGU)
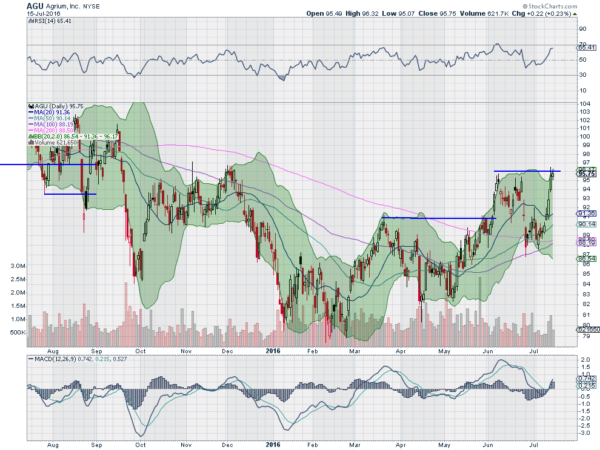
Agrium, AGU, marched lower from a high in March 2015, finding support in February over 30% lower. It consolidated for a month and then started higher making its first higher high in March 2016 before pulling back. A higher low and then a push to another higher high starts the uptrend.
The RSI is bullish and rising and the MACD is crossed up. Look for a move over the May/June highs to participate to the upside…..
American International Group Inc (NYSE:AIG)
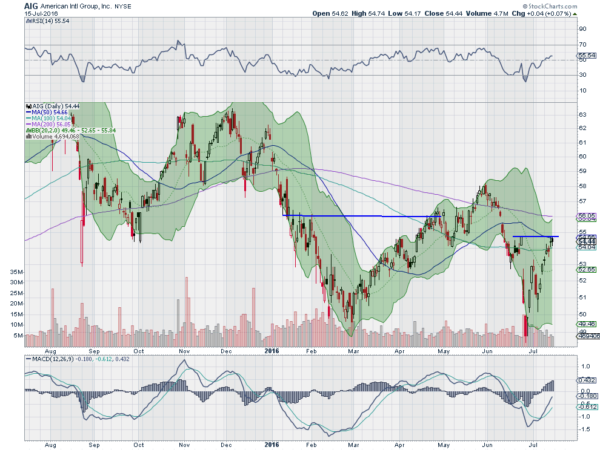
AIG, had a hard leg down at the start of the year. It started moving back higher in March but found resistance at a lower high at the end of May. The leg down that followed made a lower low before bouncing recently. Friday found the price back at resistance and the 50 day SMA. The RSI is rising and the MACD moving higher. Look for a push above resistance to participate to the upside…..
CIT Group Inc DEL (NYSE:CIT)
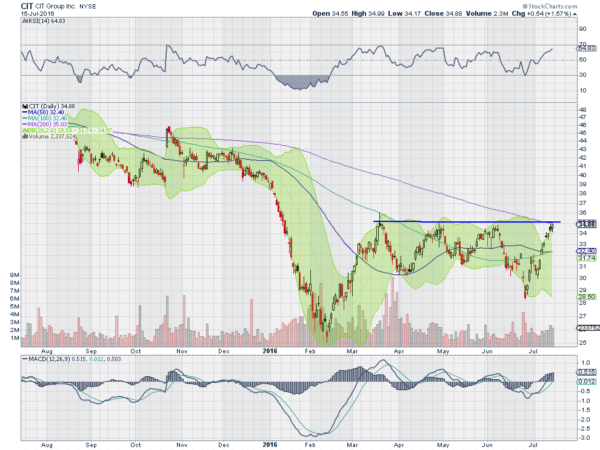
CIT had a quick fall to start the year, losing over 45% of the stock value in in two months. It bounced in February but found resistance in March. Since then it has oscillated between 30 and 35 with a brief dip under following the Brexit vote. The move Friday brought it back to resistance and the 200 day SMA for the first time since October. The RSI is in the bullish zone and rising and the MACD is bullish as well. Look for a push over resistance to participate to the upside…..
Eaton Corporation PLC (NYSE:ETN)
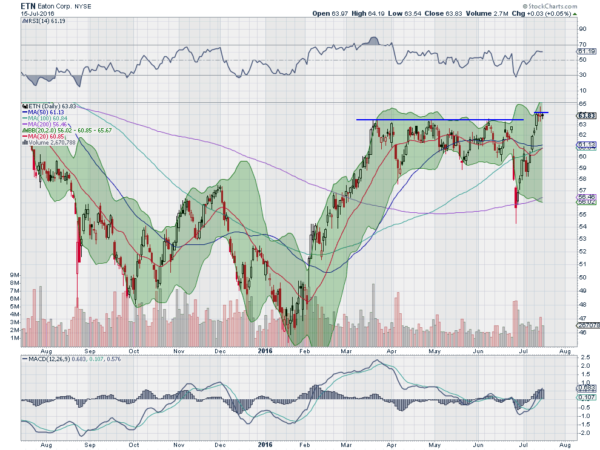
Eaton, ETN, rose off of a bottom in January, to find resistance at 63 in March. It has stayed close to that, consolidating sideways ever since. Last week saw a probe higher with consolidation after the move. The RSI is nudging into the bullish zone and the MACD is rising, both support a move higher. Look for a move through resistance to participate to the upside…..
Williams Companies Inc (NYSE:WMB)
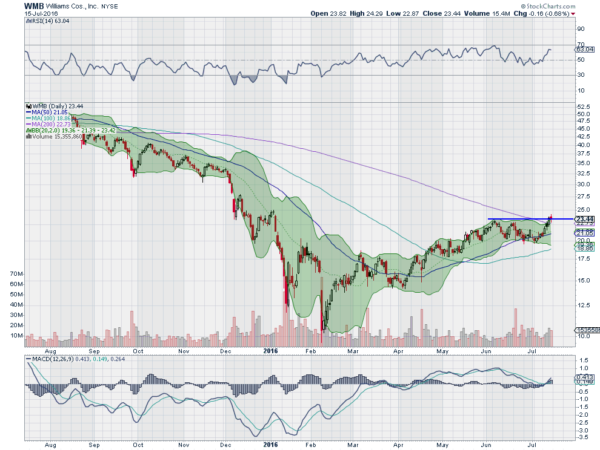
Williams, WMB, started moving lower in mid-2015. The 50 day SMA crossed down through the 200 day SMA, a Death Cross, in September and the stock stayed below the 50 day SMA for the next 6 months. In March it broke above its 50 day SMA and started making higher highs.
It met resistance in June and pulled back, and now is back at that level and touching the 200 day SMA for the first time in almost a year. The RSI is in the bullish zone and the MACD crossed and rising. Look for a push over the 200 day and resistance to participate to the upside. ….
Up Next: Bonus Idea
After reviewing over 1,000 charts, I have found some good setups for the week. These were selected and should be viewed in the context of the broad Market Macro picture reviewed Friday which heading into the next week sees the equity markets have been strong and may need a short term pause or pullback before resuming higher.
Elsewhere Gold may be ready to bounce in its downtrend while Crude Oil also looks like it may be ready to reverse higher. The US Dollar Index is continuing to consolidate with an upward bias while US Treasuries are biased lower in the short run in their uptrend. The Shanghai Composite looks to continue its slow reversal higher as Emerging Markets rise to test the long term resistance zone just above.
Volatility looks to remain below normal levels keeping the bias higher for the equity index ETF’s SPDR S&P 500 (NYSE:SPY), iShares Russell 2000 (NYSE:IWM) and PowerShares QQQ Trust Series 1 (NASDAQ:QQQ). Their charts also are biased to the upside in the intermediate timeframe while they consolidate in the shorter timeframe. The SPY looks most vulnerable to a short term pullback followed by the QQQ. Use this information as you prepare for the coming week and trad’em well.
DISCLAIMER: The information in this blog post represents my own opinions and does not contain a recommendation for any particular security or investment. I or my affiliates may hold positions or other interests in securities mentioned in the Blog, please see my Disclaimer page for my full disclaimer.

