After reviewing over 1,000 charts, I have found some good setups for the week. This week’s list contains the first five below to get you started early. These were selected and should be viewed in the context of the broad Market Macro picture reviewed Friday which with April expiry behind sees the equity markets held strong and look to have started back higher.
Elsewhere look for gold to consolidate while crude oil consolidates but with a bias to the upside. The US Dollar Index is testing the bottom of the consolidation range while US Treasuries look to move higher. The Shanghai Composite and Emerging Markets look strong and ready to go higher the with risk of Emerging Markets running in place a bit longer.
Volatility looks to remain subdued keeping the bias higher for the equity index ETF’s SPDR S&P 500 (NYSE:SPY), iShares Russell 2000 (NYSE:IWM) and PowerShares QQQ Trust Series 1 (NASDAQ:QQQ). Their charts also look better to the upside now with the weekly charts looking strong. Use this information as you prepare for the coming week and trad’em well.
Freeport-McMoran Copper & Gold Inc (NYSE:FCX)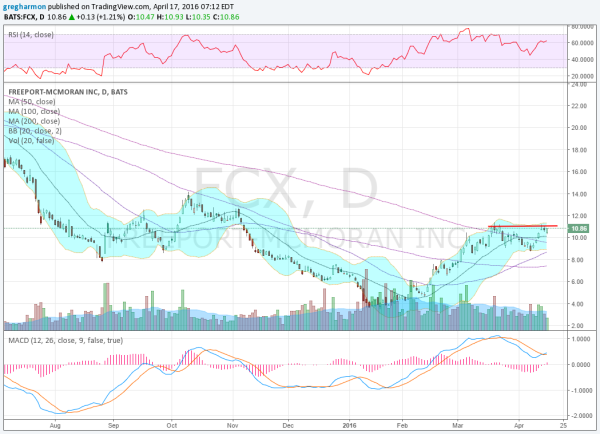
Freeport-McMoRan, FCX, has been part of the rise of the materials space. After a long run lower the last 6 months has seen a rounding bottom that has turned into a Cup and Handle. Last week it also moved back over the 200 day SMA for the first time since August 2014. The target out of the pattern is a move to 17.70. The RSI is in the bullish zone while the MACD is crossing up and rising. There is resistance higher at 11.10 and then 11.45 followed by 12.65 and 14.15 before 15 and 16.50 then 17.20. Support lower comes at 10.30 and 8.90. Short interest is high at 13.6%. Enter long on a move over 11.10 with a stop at 10.40. As it moves over 11.40 move the stop to break even and then to a 40 cent trailing stop over 11.55. Take off 1/3 on a stall at 17.70 or higher. As an options trade consider the April 22 Expiry 11 Calls (offered at 39 cents late Friday) and trade them like the stock trade (using the stock price as a trigger, stop, and target). Sell the April 22 Expiry 10 Puts (14 cents) to lower the cost. The company is expected to report earnings April 26th.
Juno Therapeutic (NASDAQ:JUNO)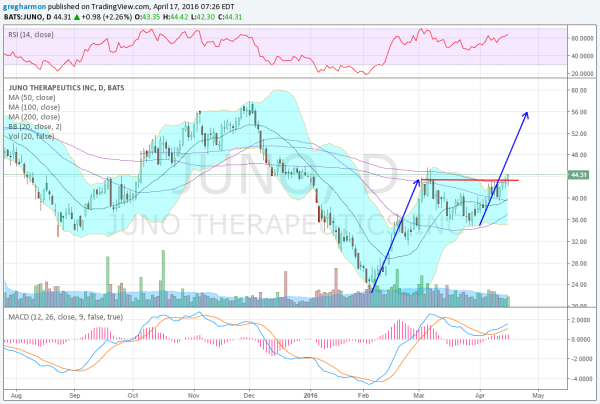
Juno Therapeutics, JUNO, ran in a straight line lower from the beginning of December until finding a bottom in early February. Since then it rose to the December consolidation zone and 200 day SMA and then pulled back. The dip was shallow and it reversed back higher at the end of March. Friday saw the price press through the 200 day SMA and prior resistance to a higher high. A Measured Move higher gives a target near 56. The RSI is bullish and rising and the MACD is rising too. There is resistance higher at 46 and 47.60 followed by 49 and 52.60 before 56 and 57.65. Support lower comes at 43.50 and 41.60. Short interest is high at 11.3%. Enter long now (over 43.50) with a stop at 42. As it moves over 45.50 move the stop to break even and then to a $1.50 trailing stop over 46. Take off 1/3 on a stall at 56 or higher. As an options trade consider the May 45 Calls ($3.60) and trade them like the stock trade. Sell the May 35 Puts (75 cents) and or the May 55 Calls ($1.30) to lower the cost, adding leverage.
Papa John's International Inc (NASDAQ:PZZA)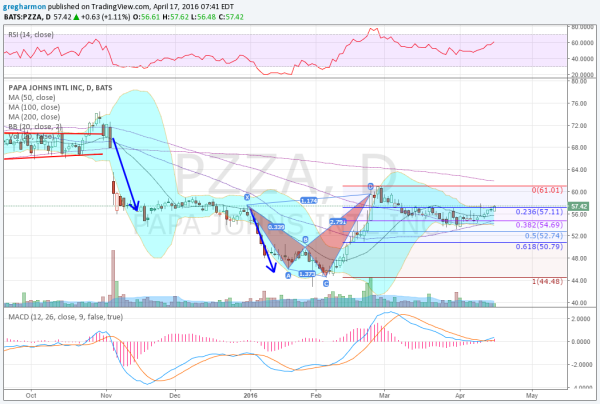
Papa John’s, PZZA, fell hard in November and consolidated but then ran an equal move lower to start the year. The last leg down proved to be the first leg of a bearish Shark harmonic, with the price bouncing and then finding resistance just above the Potential Reversal Zone (PRZ). It retraced 38.2% of the pattern before starting to round higher the last few days. The RSI is now moving into the bullish zone with the MACD crossing up and rising. There is resistance at 58.65 and 61 followed by 66.20 and a gap to fill to 67.90, then 70.50 and 74.35. Support lower comes at 55.25 and 53.80. Short interest is high at 12.6%. Enter long on a move over 57.50 with a stop at 55.25. As it moves over 58.50 move the stop to break even and then to a $1.40 trailing stop over 59. Take off 1/3 on a stall at 67.90 or higher. As an options trade consider the May 57.5 Calls ($2.85) and trade them like the stock trade. Sell the May 65 Calls (50 cents) to lower the cost and sell the May 52.5 Puts ($1.10) to add leverage.
TherapeuticsMD Inc (NYSE:TXMD)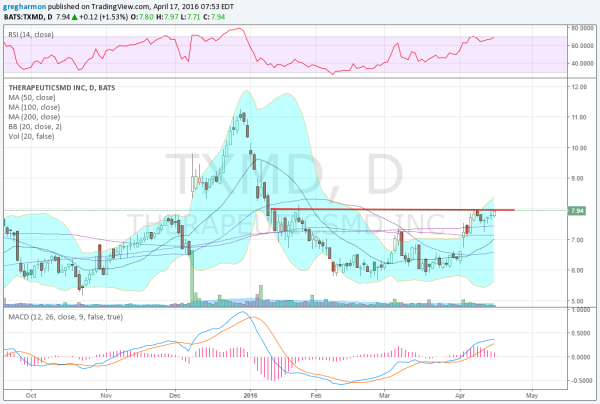
TherapeuticsMD, TXMD, spiked to a high over 11 in December and then sold off just as fast. It went through a bottoming process the first Quarter of the year before it found its way back to resistance in April. A small pullback and then bounce gives a modified Cup and Handle or 2 headed Inverse Head and Shoulders pattern both with a target to 10. The RSI is bullish and rising while the MACD is rising too. There is resistance higher at 8 and 8.35 followed by 9.05 and 10.15 before 11.15. Support lower comes at 7.60 and 7.25 before 6.65. Short interest is high at 22.2%. Enter long on a move over 8 with a stop at 7.65. As it moves over 8.30 move the stop to break even and then to a 45 cent trailing stop over 8.50. Take off 1/3 on a stall at 10 or higher. As an options trade consider the May 7.5 Calls ($1.15) and trade them like the stock trade.
Western Union Company (NYSE:WU)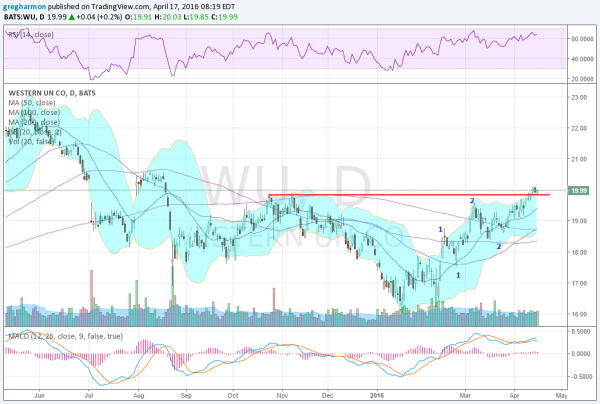
Western Union, WU, ran lower in a couple of stages from a May 2015 high over 22 to a low of 16. Since that bottom it has now risen, making a series of higher lows and higher highs. Last week it pushed above the top of the October bounce and is now consolidating. The RSI is rising and bullish while the MACD is moving back higher as well. There is resistance above at 20.20 and 20.60 followed by 21 and 21.50 before 22 and 22.50. Support lower comes at 19.80 and 19.50 followed by 18.50. Short interest is high at 12.6%. Enter long now (over 19.80) with a stop at 19.60. As it moves over 20.35 move the stop to break even and then to a 35 cent trailing stop over 20.45. Take off 1/3 on a stall at 22.60 or higher. As an options trade consider the May 20 Calls (70 cents) and trade them like the stock trade.
DISCLAIMER: The information in this blog post represents my own opinions and does not contain a recommendation for any particular security or investment. I or my affiliates may hold positions or other interests in securities mentioned in the Blog, please see my Disclaimer page for my full disclaimer.
