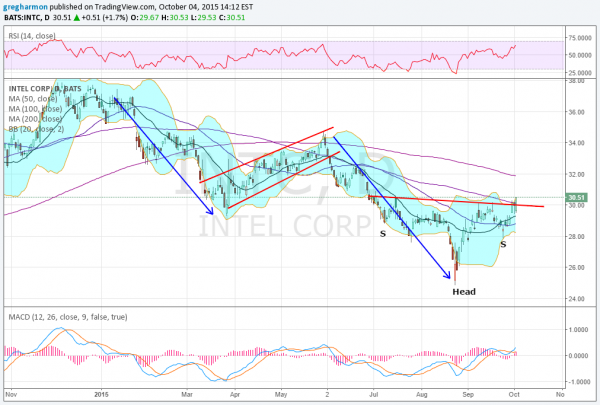
Intel (NASDAQ:INTC) stock had a consolidation period straddling the turn of the year and then started a downward trend. The two major moves lower were nearly identical in price change. It bottomed at the August 24 low with the market and started back higher. A brief pullback to higher support with the sell off two weeks ago then reversed back higher.
The total of the price action since the end of June has been an Inverted Head and Shoulders pattern. The neckline, in red on the chart, is falling slightly. A break above that neckline carries a price objective of at least 35.37 and price did break above it Friday with a near-bullish Marubozu candle.
It also moved above the 100-day SMA for the first time since June 3 with only the 200-day SMA above still. The Bollinger Bands® are opening to allow a further move up. The RSI is also rising and bullish with the MACD crossed up and rising. There is support lower at 29.40 and 28.25 before 25.00. Resistance to the upside may come at 30.55 and 31.10 before 32.50 and 33.50 followed by 34.65. Short interest is moderate at 2.5%.
The options chains show a lot of open interest this week ahead of the earnings report on October 13 after the market closes. It is spread out on the Put side from 26 to 30, but much larger and focused from 30 to 31 on the Call side. Next week’s chain, covering earnings, shows extremely large open interest at the 29 Put Strike while the Call side is large from 29 to 32 with the peak at 31. Longer term November options favor the upside with open interest from 30 to 32 and then at 35, while smaller size on the Puts spread from 23 to 29 and then large at 35.
Trade Idea 1: Buy the stock with a stop at 29.40 for aggressive traders and 27.50 for less aggressive traders.
Size according to your stop and risk tolerance.
Trade Idea 2: Buy the October 9 Expiry 30.5 Calls (offered at 45 cents late Friday).
A defined risk way to participate in the upside.
Trade Idea 3: Buy the October 9 Expiry 30.5/31 1×2 Call Spread (6 cents).
A trade for the upside with leverage relying on the large open interest at 31 to draw and hold the stock this week.
Trade Idea 4: Buy the October 30/31 Call Spread (58 cents) and sell the October 29 Put (30 cents).
Spanning the earnings event, gives a leveraged upside trade with nearly 4:1 reward to risk.
Trade Idea 5: Buy the October/November 32 Call Calendar (30 cents) and sell the October 29 Put (30 cents).
Looks for a rise through next weeks earnings event but not above the large open interest at 32 in October, before continuing higher afterwards.
After reviewing over 1,000 charts, I have found some good setups for the week. These were selected and should be viewed in the context of the broad Market Macro picture reviewed Friday which, heading into the first full week of October sees the indexes again have dodged a bullet and ended the week on strength.
Elsewhere look for gold to continue to consolidate in its downtrend while crude oil consolidates in its downtrend. The US Dollar Index looks to mark time as it consolidates its move higher while US Treasuries are biased higher in the short term. The Shanghai Composite looks to continue to consolidate in its trend lower while Emerging Markets are biased to the upside in broad consolidation after their move lower.
Volatility looks to remain elevated but moving back toward normal levels easing the headwind for the equity index ETF’s (NYSE:SPY), (NYSE:IWM) and (NASDAQ:QQQ). The indexes themselves all look good in the short term while they consolidate in the intermediate term. Use this information as you prepare for the coming week and trad’em well.
The information in this blog post represents my own opinions and does not contain a recommendation for any particular security or investment. I or my affiliates may hold positions or other interests in securities mentioned in the Blog, please see my Disclaimer page for my full disclaimer.
