Macy’s (NYSE:M) on 34 St. in New York is the world’s largest department store. It made a movie there in 1947, 70 years ago and it included their rival Gimbels. Macy’s eventually bought out Gimbels and went on expanding. Recently that physical store presence has been sighted as a high cost overhead when competing against online retailers, for Macy’s and every other Department store.
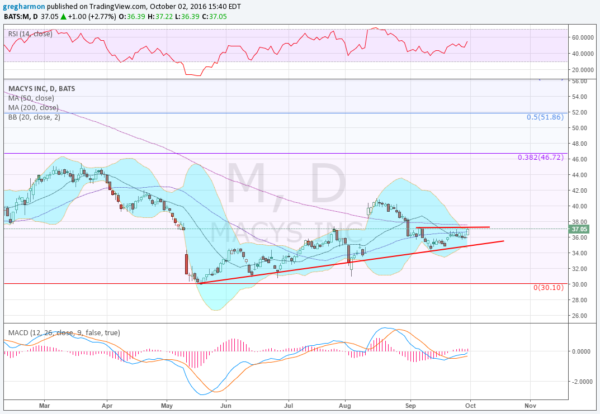
From July 2015 to May 2016 their stock price took a hit as a result. In the end it lost nearly 60% of its value. But since that May low it has been steadily moving higher. A series of higher lows rising nearly perfectly against trend support, and higher highs to boot. Since the start of September though it has found resistance to the upside at 37.25.
Friday broke a small consolidation to the upside and hit that resistance again. A push over the top now would give a short term target to 40. The Bollinger Bands® are squeezed in and starting to release the price to the upside while the RSI is moving up in the bullish zone and the MACD is crossed up and rising.
The weekly options chain this week shows the bulk of the open interest focused at 36.50 below. Next week sees lighter open interest and the October monthly chain is biased to the Call side with big open interest at 36 and 37. There is some size above at 38 as well and then smaller on the Put side at 36 and 35. The November options, the first after the next earnings report with any sizable open interest, have very large Call side interest above from 38 to 41.
Trade Idea 1: Buy the stock on a move over 37.25, with a November 37/33 Put Spread ($1.40) and selling a November 41 Covered Call (67 cents). This gives protection to 33 through earnings and upside to 41 for added cost of less than 80 cents. Cheaper than a 5% stop, right?
Trade Idea 2: Buy the October/November 38 Call Calendar ($1.05). Big open interest lower in October may hold the stock or draw it back near expiry before a move higher into November.
Trade Idea 3: Buy the November 33/38/41 Call Spread Risk Reversal (33 cents, also known as a Seagull). This gives high leverage for a longer dated move.
After reviewing over 1,000 charts, I have found some good setups for the week. These were selected and should be viewed in the context of the broad Market Macro picture reviewed Friday, which heading into Q4, sees the equity markets looking strong with the QQQ leading the way.
Elsewhere, look for gold to pullback short term while crude oil continues to the upside. The US Dollar Index looks to remain asleep moving sideways while US Treasuries are biased lower. The Shanghai Composite looks to continue the drift lower around 3000 while Emerging Markets consolidate.
Volatility looks to remain subdued keeping the bias higher for the equity index ETF’s SPY (NYSE:SPY), (NYSE:IWM) and QQQ. Their charts show strength in the QQQ leading higher, with the SPY just behind and the IWM taking a breather, the weakest of the bunch. Use this information as you prepare for the coming week and trad’em well.
