Here is your Bonus Idea with links to the full Top Ten:
Perrigo (N:PRGO) stock jumped higher in April when it was announced that Mylan (O:MYL) was bidding for the company. This was not a friendly bid, and it has played out in a sue and countersue way ever since.
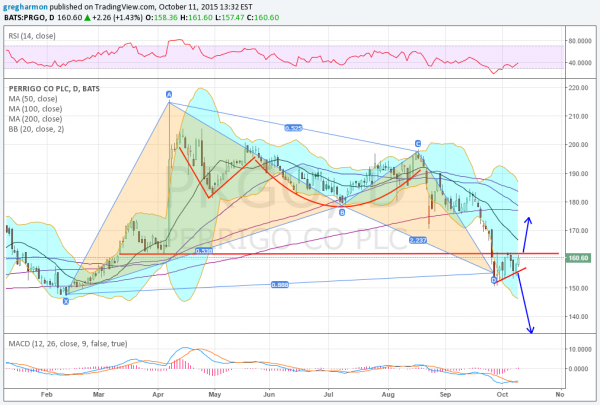
The chart shows the stock price popping on the initial news and then a Adam and Eve consolidation that failed to launch it higher. Instead, the stock fell back with the Healthcare sell off in late September, ending below the pre-bid price. It has been basing there in a ascending triangle for 2 weeks, tightening against 162 as former support becomes resistance.
A break of the resistance to the upside would target a move to 174. A break to the downside, though, would look for a Measured Move lower to 130. The momentum indicators are more positive than negative, supporting the upside. The RSI is rising out of an oversold condition, while the MACD has crossed up.
There is a harmonic pattern in the price action as well. It is a bullish Bat harmonic, also known as a Cypher. This completed at the Potential Reversal Zone at 155 and triggered with the reversal candle the next day. This pattern calls for a retracement of 38.2% of the pattern or a move higher to 173.28.
There is resistance above 162 at 168.60 and 172.75 before 176.20 and 180. Support below stands at 152 and 147.50. Short interest is low at 1.7%, and the company is expected to report earnings next November 3rd.
The options chains show an upward bias for this week’s October Expiration. There is large open interest at 170 on the Call side and 165 and 170 on the Put side. Moving to the November Expiration, there is larger open interest on the Call side as well and above at the 190 and 200 Strikes. The 160 Strike is largest open interest on the Put side.
Perrigo
Trade Idea 1: Buy the stock on a move over 162 with a stop at 158.50.
A simple stock purchase.
Trade Idea 2: Buy the October 160/170 Call Spread (offered at $3.40 late Friday).
A defined risk way to participate.
Trade Idea 3: Buy the October 160/170 Call Spread and sell the October 155 Put ($2.50).
Capping return and adding leverage to the trade with a risk of owning the stock under 155 Friday.
Trade Idea 4: Buy the November 160/175 Call Spread ($8.00) and sell the November 150 Put ($3.40).
Giving the upside more time in the levered trade with further downward protection.
Trade Idea 5: Sell the stock short on a move under 155 with a stop at 160.
A straight downside trade.
Trade Idea 6: Buy the November 155 Put ($8.20).
Using defined risk to follow the stock lower.
After reviewing over 1,000 charts, I have found some good setups for the week. These were selected and should be viewed in the context of the broad Market Macro picture reviewed Friday which, heading into October Options Expiration week, sees the equity markets looking stronger, but they have not sent the all clear signal yet.
Elsewhere, look for gold to continue its short term uptrend, while crude oil does the same but might encounter resistance. The US dollar index has a short term bias lower for the week in the broad consolidation, while US Treasuries are biased lower short term as well. The Shanghai Composite looks to continue in consolidation, while Emerging Markets are biased to the upside.
Volatility looks to return to more normal levels, relieving the downward bias on the equity index ETFs N:SPY, N:IWM and O:QQQ. Their charts all show strength continuing into next week, but with the SPY the strongest followed by the QQQ and then the IWM on the longer term look. Use this information as you prepare for the coming week and trad’em well.
The information in this blog post represents my own opinions and does not contain a recommendation for any particular security or investment. I or my affiliates may hold positions or other interests in securities mentioned in the Blog. Please see my Disclaimer page for my full disclaimer.
