Here is your Bonus Idea with links to the full Top Ten:
Nasdaq Inc (O:NDAQ), makes no pretense of having a need for market makers. This market exchange is fully automated and has been so since the 80’s. The only reason they seem to have a visual office space in Times Squares seems to be to have their backdrop used as a television studio.
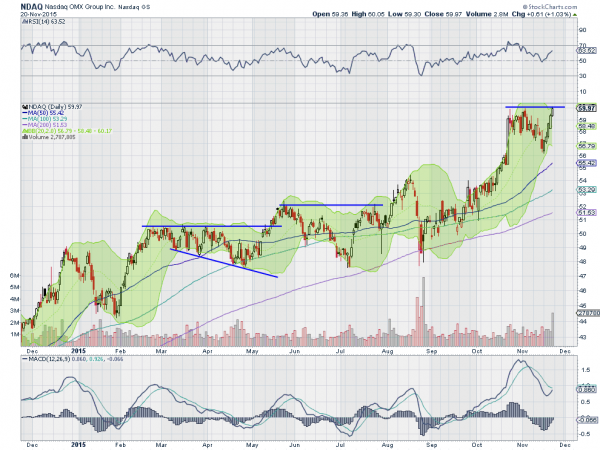
The stock price has been doing very well lately. It barely had a hiccup during the August market correction, and then even less in September. Since the August stumble it has risen 22%. Not a bad place to hide out the last few months.
But the chart looks good for more upside right now. After a consolidation at 60 the back half of October, the price pulled back slightly. Last week saw that retreat reverse and march back up to resistance at 60 again. The bull flag created on the pullback can be used to measure a target to the upside of 67.
The momentum indicators look favorable. The RSI is moving back higher after holding in the bullish zone, while the MACD is about to cross up. The Bollinger Bands® had squeezed and are now opening to allow the upside advance.
The options chains show a potential hurdle though. The December options have large open interest at the 50, 55 and 60 Strikes, without much anywhere else. With all this open interest at and below price it may be hard to move higher near expiry. Further out the options are much less active with the March options (beyond the January 28th report date) showing big open interest at the 50 and 55 Put Strikes.
Nasdaq OMX, Ticker: $NDAQ
Trade Idea 1: Buy the stock on a move over 60 with a stop at 56.
A straight stock trade.
Trade Idea 2: Buy the stock on a move over 60 and add a December 60/55 Put Spread ($1.40).
Adding protection to the stock trade.
Trade Idea 3: Buy the December 60 Calls ($1.30).
A stock substitution trade, with defined risk.
Trade Idea 4: Buy the January 60 bullish Risk Reversal (free).
A highly levered trade looking for the upside to continue.
After reviewing over 1,000 charts, I have found some good setups for the week. These were selected and should be viewed in the context of the broad Market Macro picture reviewed Friday which, heading into the shortened Thanksgiving Holiday week sees the equity markets have moved strongly higher maybe a bit too fast in the short run.
Elsewhere look for Gold to continue lower while Crude Oil consolidates in its downtrend. The US Dollar Index is consolidating with an upward bias and US Treasuries are moving higher in the consolidation range. The Shanghai Composite looks ready to resume the move higher out of consolidation and Emerging Markets are biased to the upside short term in their downtrend. Volatility looks to remain low adding some wind to the backs of the equity index ETF’s N:SPY, N:IWM and O:QQQ.
Their charts look good in the short term, with the SPY and QQQ moving higher and the IWM biased higher in consolidation. Longer term the SPY and QQQ look ready to attack their all-time highs, while the IWM lags behind. Use this information as you prepare for the coming week and trad’em well.
The information in this blog post represents my own opinions and does not contain a recommendation for any particular security or investment. I or my affiliates may hold positions or other interests in securities mentioned in the Blog, please see my Disclaimer page for my full disclaimer.
