Here is your Bonus Idea with links to the full Top Ten:
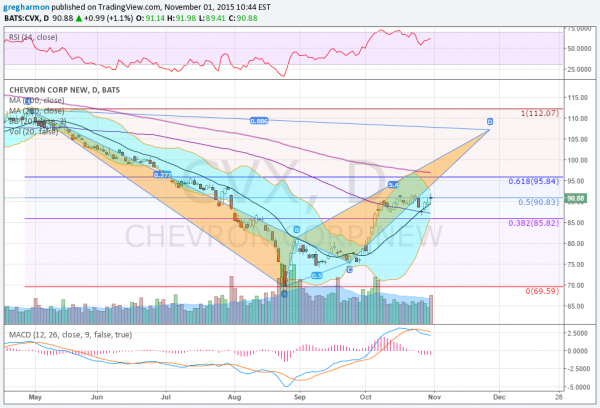
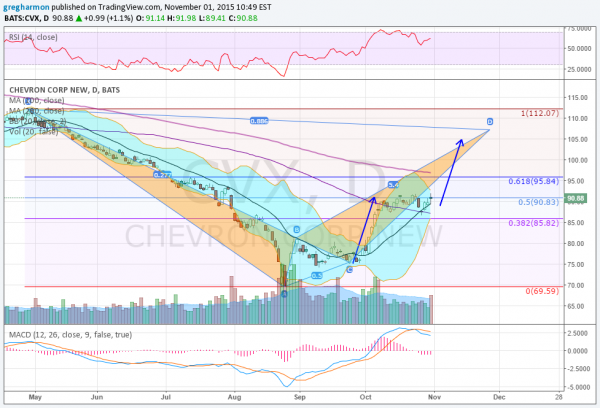
Chevron (N:CVX) had a long fall from a high over 128 in July 2014, losing nearly half of its value to the low at 69.59 in August. The last drop began in April from about 112. That has now seen a 50% retracement and consolidation for nearly a month.
The price action since April has exhibited a bearish Bat harmonic as well with a Potential Reversal Zone (PRZ) above at 107. This is very close to the Measured Move out of the current consolidation should it break to the upside. Momentum indicators are mixed with the RSI bullish and rising while the MACD is in a slight decline but kind of flat. The Bollinger Bands® are squeezing hard, often a precursor to a move.
There is resistance above at 91.85 and 95.85 followed by 98.90 and 101 before 104 and 107. Support lower comes at 87.25 and 83.20 followed by 80.70 and 74.70. Short interest is low under 2%. The company is not expected to report earnings again until January 30th 2016.
Checking the options chains shows that this week there is large open interest at the 87 Strike below on the Put side and the 93 Strike above on the Call side. Further out in the November monthly options, the 89.5 and 90 Strike have very large open interest on the Put side and the Call side is doubly large at 90 and then double again at 95.
Chevron, Ticker: CVX
Trade Idea 1: Buy the stock on a move over 92 with a stop at 88.
A straight stock trade.
Trade Idea 2: Buy the stock with a November 90/85 Put Spread and sell the December 95 Calls (45 cents for the collar).
Adding a collar to the stock to protect the downside and allow some upside room.
Trade Idea 3: Buy the January 90/November 92.5 Call Diagonal ($2.80).
A longer term options strategy, buying the January option and selling November. The plan would be to sell December as the November expire.
Trade Idea 4: Buy the January 90/November 92.5 Call Diagonal and sell the November 85 Put ($2.10).
Adds leverage to the diagonal above and another leg to the plan. As the November Puts expire sell longer puts as well.
After reviewing over 1,000 charts, I have found some good setups for the week. These were selected and should be viewed in the context of the broad Market Macro picture reviewed Friday which, heading into November sees the equity markets have regained a lot of ground lost over the summer but remain mixed.
Elsewhere look for gold to move lower while crude oil consolidates with an upward bias. The US Dollar Index is biased to the upside in consolidation while US Treasuries look to mark time sideways. The Shanghai Composite looks to continue consolidation around 3400 with an upward bias while Emerging Markets are biased to the downside.
Volatility looks to remain subdued, keeping the bias higher for the equity index ETFs N:SPY, N:IWM and O:QQQ. Their charts are mixed though. The QQQ remains the strongest and within a day’s move to new all-time highs, while the SPY seems extended and may need to consolidate or pullback first. The IWM continues to lag and is mired in consolidation. Use this information as you prepare for the coming week and trad’em well.
Disclaimer: The information in this blog post represents my own opinions and does not contain a recommendation for any particular security or investment. I or my affiliates may hold positions or other interests in securities mentioned in the Blog. Please see my Disclaimer page for my full disclaimer.

