Here is your Bonus Idea with links to the full Top Ten:
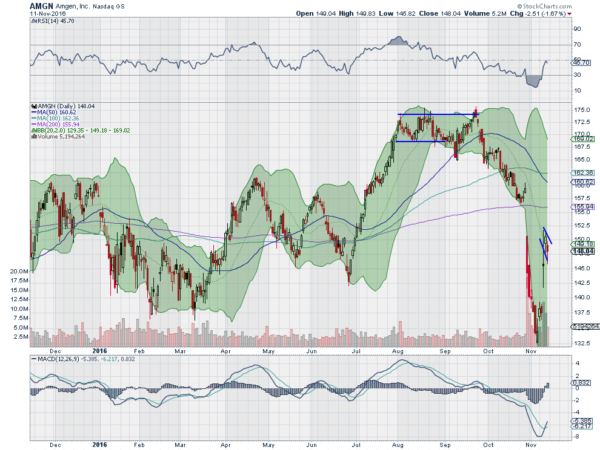
Amgen (NASDAQ:AMGN), made a top in August 2015 and fell back, finding a bottom nearly 30% lower at the end of September that year. It bounced around from there for a while until rising back to that August 2015 high in August this year. It tagged it again later in the month and then pulled back to a higher low at the 50 day SMA.
Another run up to resistance in September failed to make a new high and it fell back again. This time it dropped all the way back to the rising trend support line going back to 2014. Two weeks ago it bounced up off of that level and quickly ran to the 20 day SMA. It found resistance there and has pulled back in a bull flag. A measured move out of the flag to the upside would target 157 if it continues out of the flag to the upside Monday.
The RSI is pausing at the mid line, but rising, and the MACD is crossed up and rising. There is a lot of run higher within the wide Bollinger Bands®. The company pays a $1 dividend Monday (already trading ex-dividend) and the company is not expected to report earnings again until January 26th as they recently reported. The stock has a small 1% short float.
The November options chain show large open interest from the 139 to 160 strikes on the put side and at 145, 152.5 and 160 on the call side. No overwhelming draw this week. December options are centered at 150 on the call side with a longer tail to the upside. The December puts are biggest higher but spread more to the downside. January sees the distribution centered around 170 on the call side but at 145 on the put side.

Trade Idea 1: Buy the stock on a move over 151.40 with a stop at 146.
Trade Idea 2: Buy the stock on a move over 151.40 with a December 150/140 Put Spread ($3.85) and selling the January 155 Calls ($3.30) for a low cost Collar.
Trade Idea 3: Buy the December 150/160 Call Spread ($3.00) and sell the December 140 Puts ($1.80).
Trade Idea 4: Buy the November/December 30 Expiry 152.5 Call Calendar ($2.75) selling the November 145 Puts ($1.08).
After reviewing over 1,000 charts, I have found some good setups for the week. These were selected and should be viewed in the context of the broad Market Macro picture reviewed Friday which with the election in the rearview mirror and heading into the last full week before Thanksgiving and the holiday season begins, sees equity markets looking a bit mixed but positive.
Elsewhere look for Gold to continue lower while Crude Oil moves lower in the short term as well. The US Dollar Index looks strong and ready to challenge the 2015 highs while US Treasuries are biased continue lower. The Shanghai Composite is looking strong as it continues higher while Emerging Markets are at key support and looking weak if it does not hold.
Volatility looks to remain at lower normal levels now that the election has passed keeping the bias higher for the equity index ETF’s SPY (NYSE:SPY), iShares Russell 2000 (NYSE:IWM) and PowerShares QQQ Trust Series 1 (NASDAQ:QQQ). Their charts are a bit mixed though with the IWM leading a charge higher towards new all-time highs while the SPY stalls just below highs and the QQQ struggles in consolidation. Use this information as you prepare for the coming week and trad’em well.
The information in this blog post represents my own opinions and does not contain a recommendation for any particular security or investment. I or my affiliates may hold positions or other interests in securities mentioned in the Blog, please see my Disclaimer page for my full disclaimer.
