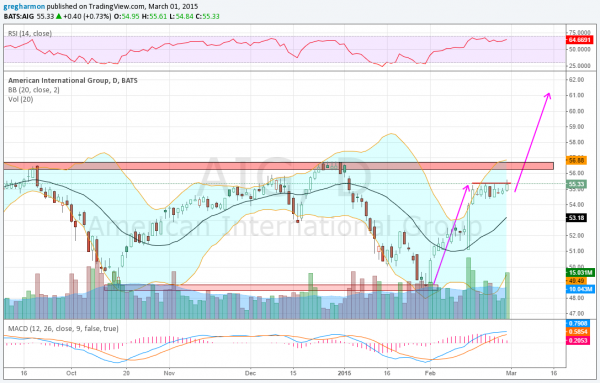
American International Group (NYSE:AIG), on first glance looks like it may just be a stock moving in a range and near the top of that range. That can be a good thing in itself. But deeper in the weeds there has been a move off of the bottom of the range to consolidation under 55.35 for almost 2 weeks. The Measured Move on a break higher targets 61 above.
Not only would that break out of the range since May 2014, but also make for a new 4 year high and spitting distance from a 9 year high. Do I have your attention now? The momentum indicators are bullish. The RSI is rising and strong while the MACD is also rising. The move Friday to resistance also took place on strong volume.
There is resistance at 55.35 and from 56.25 to 56.75 above that before breaking the range. Resistance above that comes at 61 from January 2011 and then 67 from 2008. Support lower comes at 54.40 and 52.75 followed by 51.10 and 50 before 49. Short interest is low under 1% and the company is expected to report earnings next May 11 before the market opens.
American International Group, (NYSE:AIG)

Trade Idea 1: Buy the stock on a move over 55.35 with a stop at 54.
Trade Idea 2: Buy the March 6 Expiry 55.5 Calls (offered at 35 cents late Friday).
A cheaper defined risk method to participate in upside this week.
Trade Idea 3: Buy the March 55.5 Calls (67 cents).
Giving the options more time than in no.2.
Trade Idea 4: Buy the March 52.5/55.5 bull Risk Reversal (50 cents).
Adds leverage to trade no.3 and exposure below 52.5 at March Expiry.
Trade Idea 5: Buy the May 55/April 57.5 Call Diagonals ($1.60) and sell the May 52.5 Puts (84 cents) for a net cost of 76 cents.
A longer term trade looking for the stock to stay below 57.5 by April Expiry and above 52.50 where you have downside exposure.
Trade Idea 6: Buy the January 2017 Expiry 55 Calls ($7.50) and sell the January 2017 Expiry 50 Puts (4.25) for a bullish Risk Reversal.
A very long term trade for the upside with exposure at 50.
Trade Idea 7: Buy the January 2017 Expiry 50/55 bull Risk Reversal and sell the May 57.5 Calls (net $2.40).
Reduces the cost of trade no. 6 looking for the stock to stay below 57.5 by May expiry.
After reviewing over 1,000 charts, I have found some good setups for the week. These were selected and should be viewed in the context of the broad Market Macro picture reviewed Friday which, heading into March the strength that was anticipated to close February did not appear, but weakness did not show up either.
Elsewhere look for gold to continue the short term bounce higher while Crude Oil churns in the consolidation of the downward move. The US dollar Index seems ready to move higher again while US Treasuries are biased higher short term in the pullback. The Shanghai Composite is on the cusp of another leg higher and Emerging Markets are stalled at resistance but not showing any bias.
Volatility looks to remain subdued and may drift lower keeping the bias higher for the equity index (ARCA:SPY) iShares Russell 2000 Index (ARCA:IWM) and PowerShares QQQ (NASDAQ:QQQ). Their charts are not as strong with consolidation or a pullback looking more likely in them, especially the SPY with the IWM next and QQQ strongest, holding level. Use this information as you prepare for the coming week and trad’em well.
Disclaimer: The information in this blog post represents my own opinions and does not contain a recommendation for any particular security or investment. I or my affiliates may hold positions or other interests in securities mentioned in the Blog, please see my Disclaimer page for my full disclaimer.
